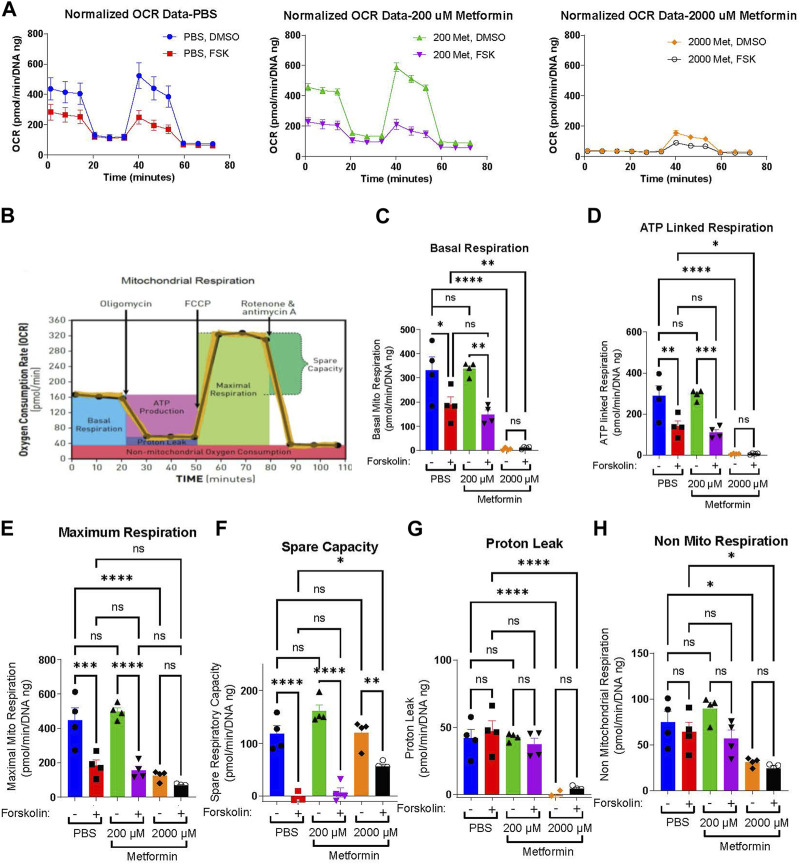
FIGURE 2.
Metformin impairs the oxygen consumption rate at high concentrations (A) Normalized Oxygen Consumption Rate (pmol/min/DNA ng) during mitochondrial flux assay for BeWo cells treated with vehicle, 200 µM metformin, or 2000 µM metformin in the presence of DMSO (0.4%, vehicle) or 40 µM forsksolin (FSK) for 48 h. (B) Schematic depicting the impact of sequential inhibitor additions to oxygen consumption rate during Seahorse Mitochondria Stress Test and bio-energetic parameters calculated from the assay. (C–H) Bar graphs representing (C) Basal Mitochondrial Respiration, (D) ATP Linked Respiration, (E) Maximal Respiration, (F) Spare Capacity, (G) Proton Leak and (H) non-mitochondrial respiration (all in (pmol/min/DNA ng)) for vehicle, 200 μM and 2000 µM metformin treated BeWo cells. n = 4 biologic replicates. Data are representative of mean ± SEM. *, p < 0.05; **, p < 0.01; ***, p < 0.001; and ****, p < 0.0001.

