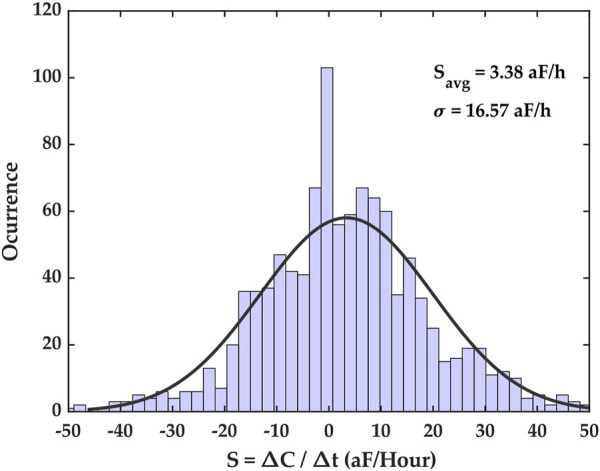
FIGURE 5.

Capacitance growth factor (S) histogram for the time series capacitance dataset. This histogram shows the extent of capacitance growth factors over the entire electrode array as well as the number of occurrences of measured capacitance growth factors in the dataset. The distribution’s mean is S avg = 3.38 aF/h, with a standard deviation of σ = 16.57 aF/h. The parameter S avg is the average capacitance growth registered during the experiment.
