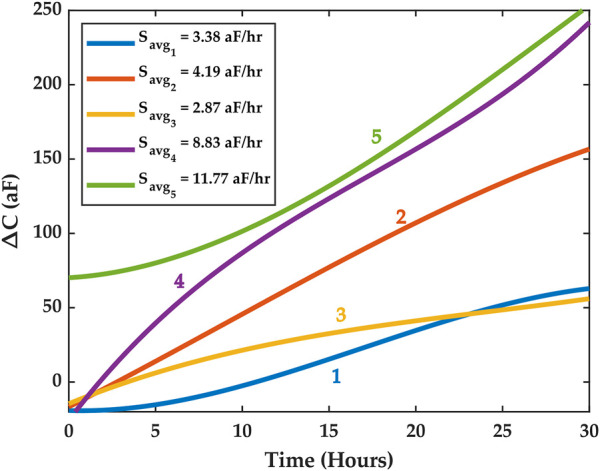
FIGURE 6.

SG trends for five experiments. The high cell culture growth phase is assumed to be within the first 30 h. Different average capacitance growth factors S avg were registered across the five experiments. The experiments are labeled 1 through 5 and color is used to distinguish them. The Supplementary Information document features an experiment where cell medium only was used, and this experiment revealed no increase in average capacitance as shown here for the five macrophage proliferation experiments.
