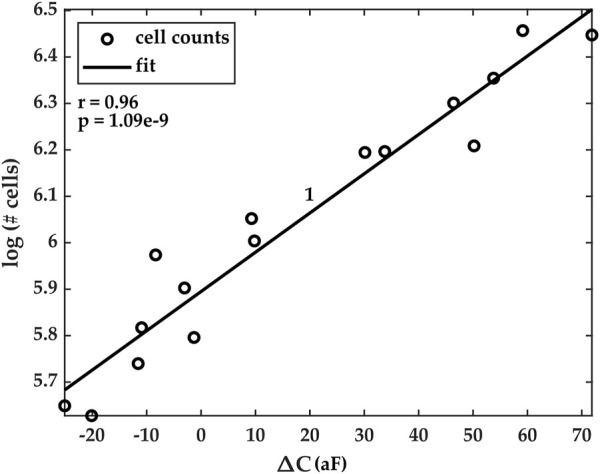
FIGURE 7.

Correlation plots of estimated cell counts (in natural logarithm scale) and the measured average capacitance. Pearson’s correlation coefficients r and its corresponding p-value for Experiment 1 are r = 0.96 and p < 10–8. Correlation plots for Experiments 2–5 are reported in the Supplementary Information document accompanying the paper.
