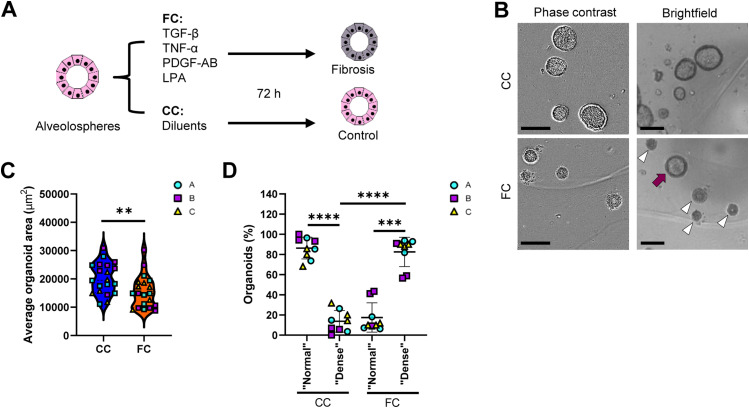
Figure 1. Fibrosis cocktail induces morphological changes in alveolospheres.
(A) Schematic showing FC stimulation of alveolospheres. (B) Representative phase contrast and brightfield images of alveolospheres stimulated with the CC or FC for 72 h. 4x magnification. Purple arrow: organoid with a “normal” morphology, white arrow heads: organoids with “dense” morphology. Scale bar = 250 μm for phase contrast, 200 μm for brightfield. (C) Average organoid areas of alveolospheres stimulated with either CC or FC. ** = P < 0.01 by unpaired, two-tailed t-test. n = 5–8 independent images per batch from three batches of alveolospheres. (D) Percentage of organoids with a “normal” morphology and “dense” morphology in brightfield images of CC- and FC-stimulated cultures. **** = P < 0.0001, *** = P < 0.001 by repeated measures one-way ANOVA with Sidak’s multiple comparisons test. n = 3 independent images per batch from three batches of alveolospheres. See also Figs S1–S4.

