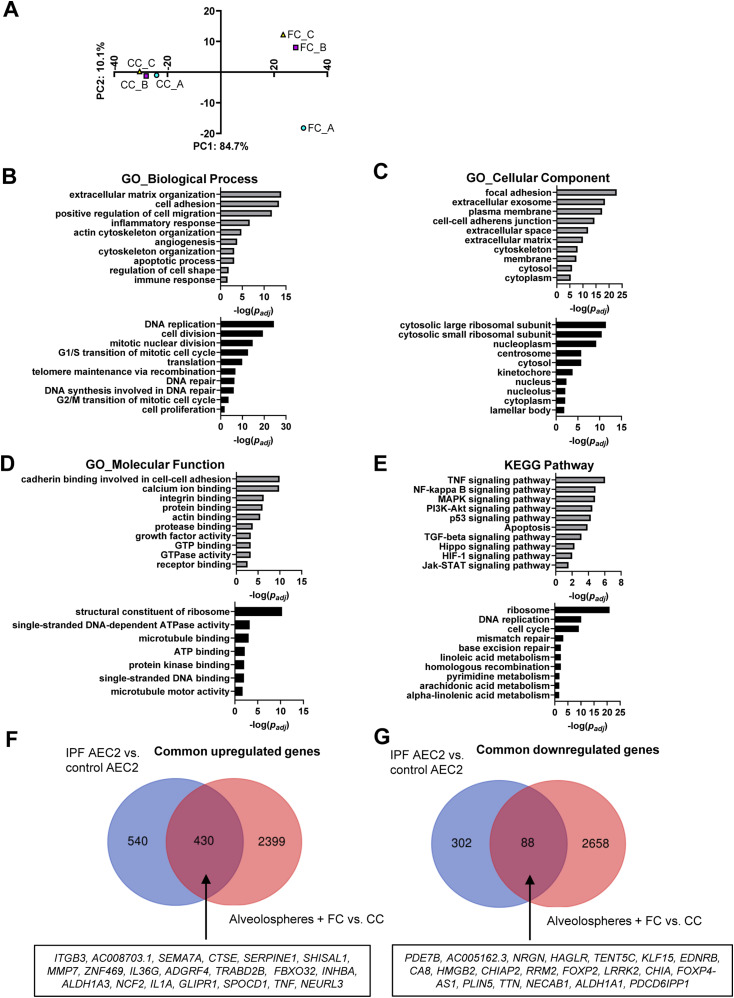
Figure 2. Fibrosis cocktail induces transcriptomic changes linked to IPF.
(A) PCA plot of RNA-seq data, top 1,000 transcripts by coefficient of variation. n = 3 batches of alveolospheres. (B, C, D, E) Gene enrichment analyses of the up-regulated (grey) and down-regulated (black) genes according to their gene ontology (GO) biological process, GO cellular component, GO molecular function, and associated Kyoto Encyclopedia of Genes and Genomes pathway. (F, G) Venn diagrams of common dysregulated transcripts in FC-stimulated alveolospheres and primary AEC2 isolated from IPF patients (GEO: GSE94555). Selected top 20 dysregulated genes (by absolute fold change) are denoted in the boxes. For (B, C, D, E, F, G): genes selected by P(adj) < 0.05, absolute log2 fold change ≥ 0.7. See also Figs S5 and S6, and SdataF2.1–F2.11.
Source data are available for this figure.

