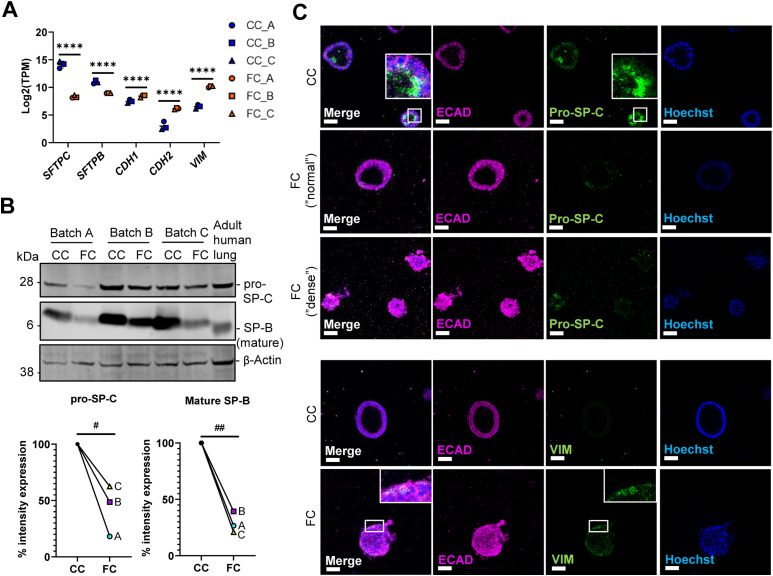
Figure 3. Fibrosis cocktail induces epithelial injury.
(A) Expression of the selected epithelial and reprogramming-associated genes. Data presented as means ± SD. **** = P(adj) < 0.0001. n = 3 batches of alveolospheres. (B) Western blot of intracellular protein lysates from alveolospheres stimulated with CC or FC. Adult human lung lysate as positive control. Signal was quantified as band intensity normalised to β-actin and expressed as percentages compared with the respective CC sample set to 100% expression. ## = P < 0.01, # = P < 0.05 by one sample t-test on the percentage intensity compared with a hypothetical value of 100. n = 3 batches of alveolospheres. Blots are cropped from the same membrane and are obtained by sequential blotting as outlined in Supplemental Data 1 (25KB, docx) . (C) Immunofluorescence of alveolospheres stimulated with CC or FC. Insert shows a vesicular-like cytosolic pattern of pro-SP-C staining in the alveolospheres (upper panel) or individual cells positive for vimentin (lower panel). Scale bar = 50 μm. See also Fig S7.

