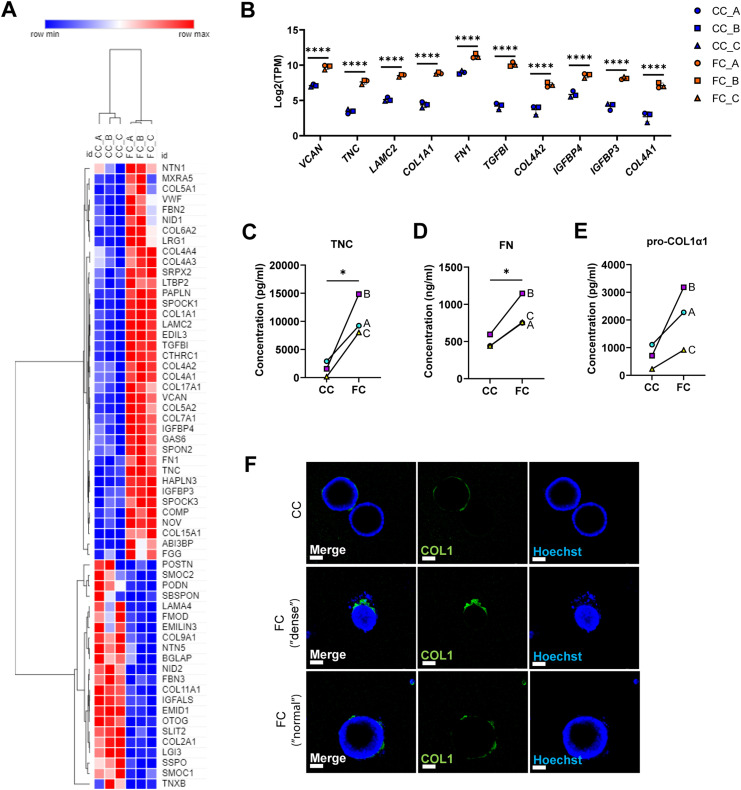
Figure 6. Fibrosis cocktail induces production of ECM.
(A) Heatmap of significantly dysregulated matrisome genes in FC-stimulated alveolospheres by absolute fold change (P(adj) < 0.05). (B) Selected matrisome genes from the Core Matrisome gene set in Table 1 in Naba et al (57) with the highest expression in FC-stimulated alveolospheres (P(adj) < 0.05, log2[TPM] ≥ 5, log2 fold change ≥ 2). Data presented as means ± SD. **** = P(adj) < 0.0001. n = 3 batches of alveolospheres. (C) Secreted concentrations of tenascin C measured by ELISA. * = P < 0.05 by paired, two-tailed t-test. (D) Secreted concentrations of fibronectin measured by ELISA. * = P < 0.05 by paired, two-tailed t-test. (E) Secreted concentrations of pro-collagen 1α1 measured by ELISA. Paired, two-tailed t-test performed. (F) Immunofluorescence of alveolospheres stimulated with CC or FC under non-permeabilised conditions. Scale bar = 50 μm. See also Fig S10.

