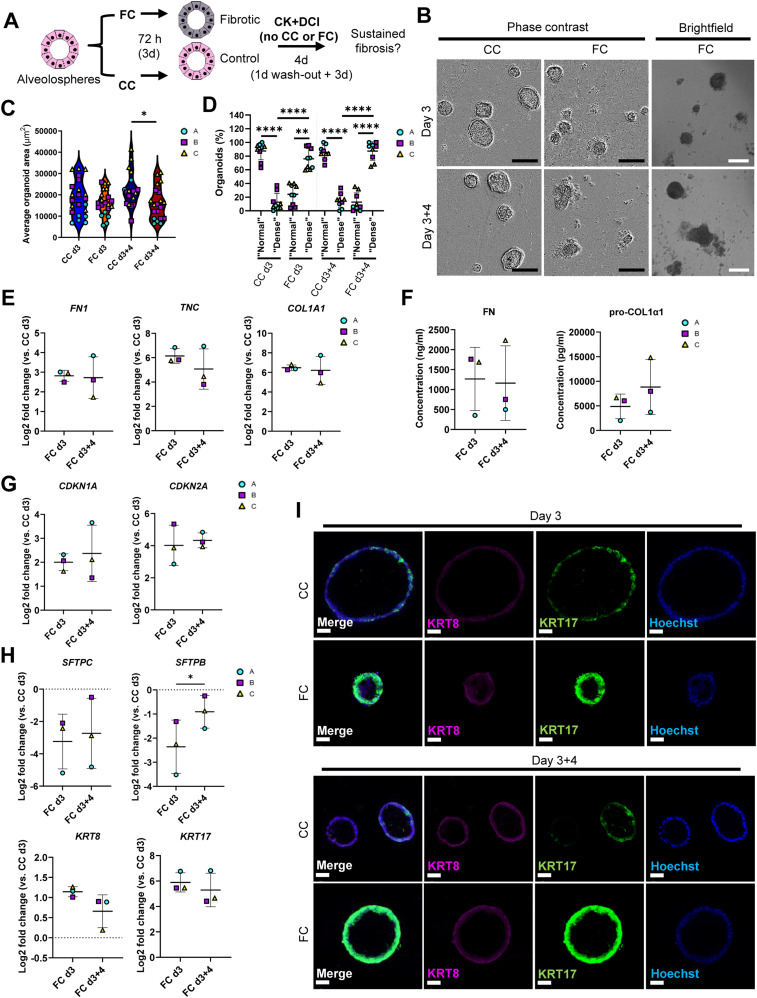
Figure 7. Effects of the fibrosis cocktail persist after withdrawal.
(A) Schematic showing FC stimulation of alveolospheres to assess persistence of fibrotic responses. (B) Representative phase contrast and brightfield images of alveolospheres stimulated with the CC or FC for 3 d and after withdrawal of the CC or FC for additional 4 d. 4x magnification. Scale bar = 250 μm for phase contrast, 200 μm for brightfield. (C) Average organoid areas of alveolospheres stimulated with either CC or FC and after withdrawal. * = P < 0.05 by one-way ANOVA with Sidak’s multiple comparisons test. n = 3–8 independent images per batch from three batches of alveolospheres. (D) Percentage of organoids with “normal” and “dense” morphologies in brightfield images of CC- and FC-stimulated cultures at 3 d of stimulation and after withdrawal of the CC or FC for an additional 4 d. **** = P < 0.0001, ** = P < 0.01 by repeated measures one-way ANOVA with Sidak’s multiple comparisons test. n = 3 independent images per batch and time point from three batches of alveolospheres. (E) Expression of genes measured by qRT–PCR related to ECM production. (F) Secreted protein concentrations of fibronectin and pro-collagen 1α1 in the medium measured by ELISA. Data presented as means ± SD. Paired, two-tailed t-test performed. n = 3 batches of alveolospheres. (G) Expression of genes measured by qRT–PCR related to cell cycle arrest. (H) Expression of genes measured by qRT–PCR related to alveolar epithelial injury and reprogramming. (I) Immunofluorescence of alveolospheres stimulated with CC or FC after 3 d of stimulation and after an additional 4 d of CC or FC withdrawal. Scale bar = 50 μm. For (E, G, H): Expression of genes normalised to the average CT value of the reference genes GAPDH, TBP, and HPRT1. Fold changes (2−ΔΔCT) calculated by comparison with the average ΔCT value of the CC day 3 population. Data presented as means ± SD. Significance tested by paired, two-tailed t-test. n = 3 batches of alveolospheres. See also Figs S11 and S12.

