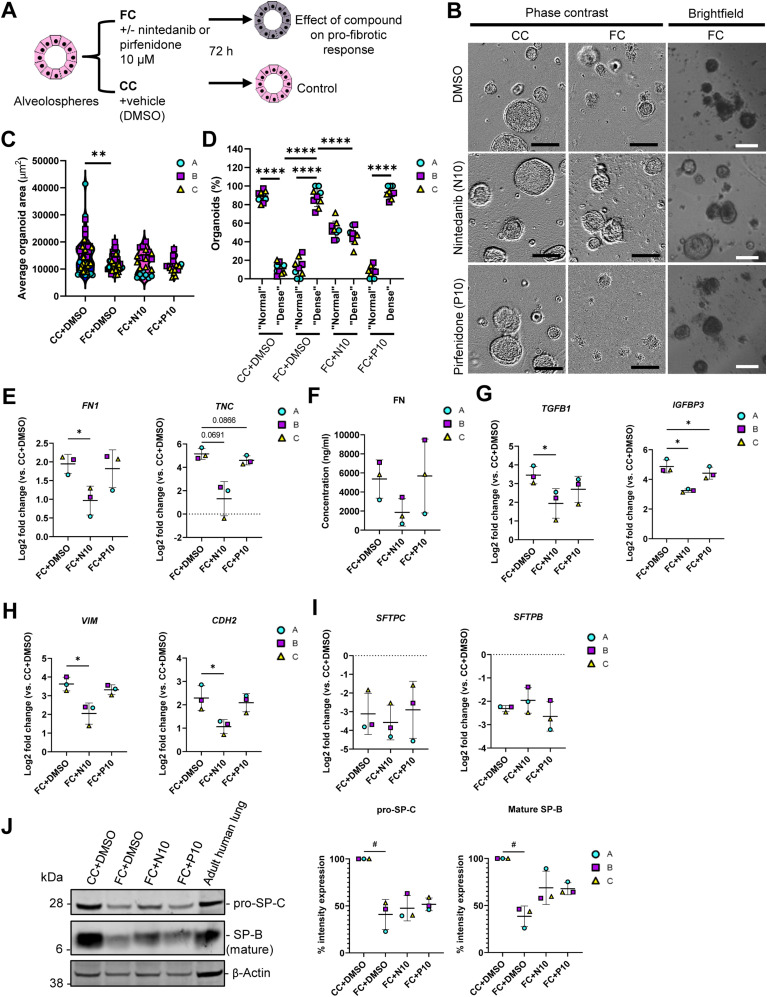
Figure 8. Fibrotic alveolospheres respond to anti-fibrotic treatment.
(A) Schematic depicting prophylactic treatment of FC-stimulated alveolospheres with nintedanib or pirfenidone. (B) Representative phase contrast and brightfield images of alveolospheres stimulated with the CC or FC for 72 h with or without 10 μM nintedanib or pirfenidone. 4x magnification. Scale bar = 250 μm for phase contrast, 200 μm for brightfield. (C) Average organoid areas of alveolospheres stimulated with either CC or FC with or without 10 μM nintedanib or pirfenidone. ** = P < 0.01 by one-way ANOVA with Dunnett’s multiple comparisons test (comparisons to FC+DMSO). n = 8–16 independent images from each of three batches and for each condition of alveolospheres. (D) Percentage of organoids with “normal” and “dense” morphologies in brightfield images of alveolospheres stimulated with CC or FC for 72 h with or without 10 μM nintedanib or pirfenidone. **** = P < 0.0001 by repeated measures one-way ANOVA with Sidak’s multiple comparisons test. n = 3 independent images per batch and time point from three batches of alveolospheres. (E) Expression of genes measured by qRT–PCR related to ECM production. * = P < 0.05. (F) Secreted protein concentrations of fibronectin in the medium measured by ELISA. Data presented as means ± SD. Repeated measures one-way ANOVA (comparisons with FC+DMSO) performed. n = 3 batches of alveolospheres. (G) Expression of genes measured by qRT–PCR related to pro-fibrotic signaling. * = P < 0.05. (H) Expression of genes measured by qRT–PCR related to alveolar epithelial reprogramming. * = P < 0.05. (I) Expression of genes measured by qRT–PCR related to alveolar epithelial injury. (J) Representative Western blot of intracellular protein lysates from alveolospheres stimulated with CC+DMSO or FC+DMSO and treated with either nintedanib (FC+N10) or pirfenidone (FC+P10). Adult human lung tissue lysate is positive control. The signal was quantified as band intensity normalised to β-actin and expressed as percentages compared with the respective CC+DMSO sample which is set to 100% expression. Data presented as means ± SD (FC+DMSO, FC+N10 and FC+P10). # = P < 0.05 by one sample t-test on the percentage intensity compared with a hypothetical value of 100 (CC+DMSO versus FC+DMSO) and repeated measures one-way ANOVA test were performed (FC+DMSO versus FC+N10 or FC+P10). n = 3 batches of alveolospheres. Blots are cropped from the same membrane and are obtained by sequential blotting as outlined in Supplemental Data 1 (25KB, docx) . For (E, G, H, I): expression of genes normalised to the average CT value of the reference genes GAPDH, TBP, and HPRT1. Fold changes (2−ΔΔCT) calculated by comparison with the average ΔCT value of the CC+DMSO population. Data presented as means ± SD. Significance tested by repeated measures one-way ANOVA, if significant with Dunnett’s multiple comparisons test (comparisons to FC+DMSO). n = 3 batches of alveolospheres. See also Figs S13–S16.

