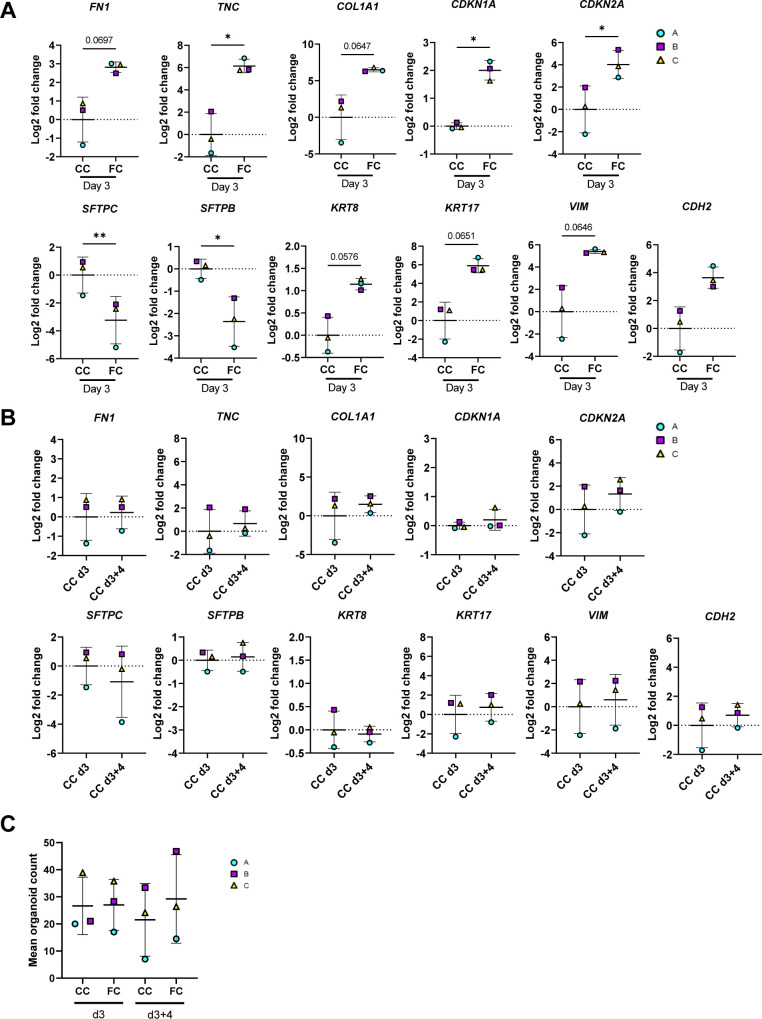
Figure S11. Assessment of markers for evaluation of fibrosis cocktail effects after withdrawal.
Related to Fig 7. (A) Expression of genes measured by qRT–PCR. The expression of the gene in each sample was normalised to the average CT value of the reference genes GAPDH, TBP and HPRT1. Fold changes (2−ΔΔCT) were calculated by comparison with the average ΔCT value of the CC day 3 population. Data presented as means ± SD. ** = P < 0.01, * = P < 0.05 by paired, two-tailed t-test. n = 3 batches of alveolospheres. (B) Baseline expression of genes in the CC samples at day 3 and after withdrawal at day 3 + 4, measured by qRT–PCR. The expression of the gene in each sample was normalised to the average CT value of the reference genes GAPDH, TBP, and HPRT1. Fold changes (2−ΔΔCT) were calculated by comparison with the average ΔCT value of the CC day 3 population. Data presented as means ± SD. Paired, two-tailed t-test performed. n = 3 batches of alveolospheres. (C) Average organoid counts per batch after stimulation with CC or FC at day 3, and after the withdrawal of the stimuli at day 3 + 4. n = 3–8 independent images per batch from three batches of alveolospheres. Repeated measures one-way ANOVA (comparisons of CC d3 versus FC d3 and CC d3+4 versus FC d3+4) performed.

