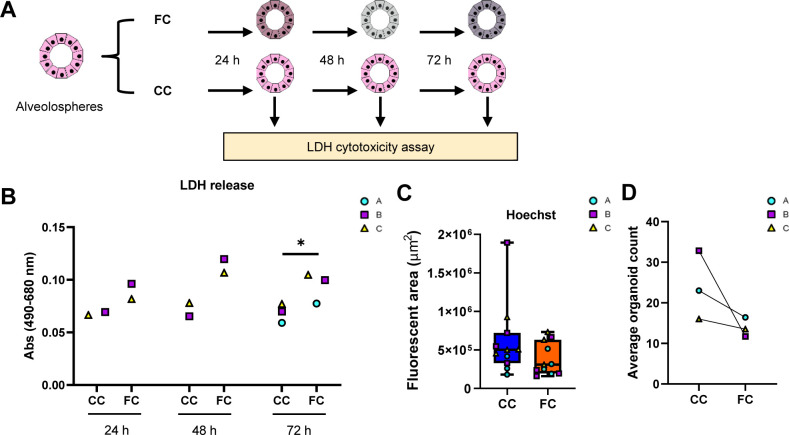
Figure S4. Cell death-related readouts after FC stimulation of alveolospheres.
Related to Fig 1. (A) Schematic illustrating the time points for LDH cytotoxicity measurement during FC stimulation of alveolospheres. (B) LDH release detected in a secreted medium of alveolospheres stimulated with either the CC or the FC at different time points of stimulation. Data presented as means of absorbance values of eight technical replicates for each batch. * = P < 0.05 by paired, two-tailed t-test. n = 2–3 batches of alveolospheres. (C) Quantification of fluorescent area of Hoechst in CC- and FC-stimulated alveolospheres. Boxplots indicate medians with minimum and maximum. n = 3–4 independent regions for each condition and each batch of alveolospheres, in total, three batches. Unpaired, two-tailed t-test performed. (D) Average organoid counts per batch after stimulation with CC or FC. n = 5–8 independent images per batch from three batches of alveolospheres. Paired, two-tailed t-test performed.

