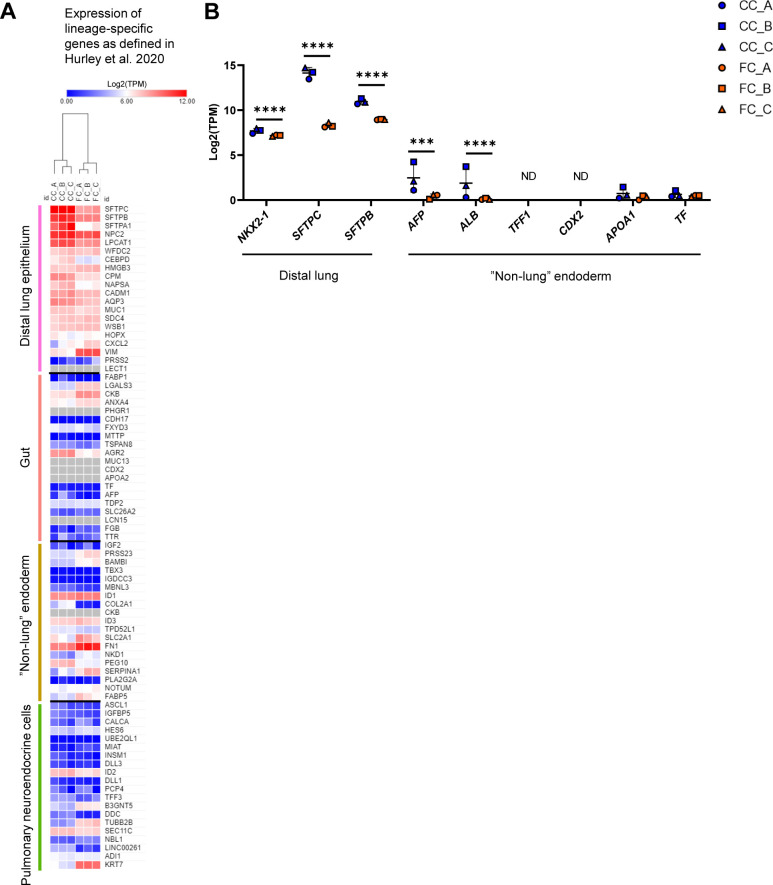
Figure S5. The transcriptomic effects induced by the fibrosis cocktail are not associated with the loss of lung phenotype in alveolospheres.
Related to Fig 2. (A) Heatmap showing expression (log2[TPM]) in CC- and FC-stimulated alveolospheres of the top differentially expressed genes from Table S3 in Hurley et al (34), characteristic for each of the single-cell clusters representing cell populations of different lineages arising during long-term alveolosphere culture. Grey colour represents no detectable expression. (B) Expression of selected genes specific for distal lung or “non-lung” endodermal cells as per Hurley et al (34). Data presented as means ± SD. **** = P(adj) < 0.0001, *** = P(adj) < 0.001, ND, not detected. n = 3 batches of alveolospheres.

