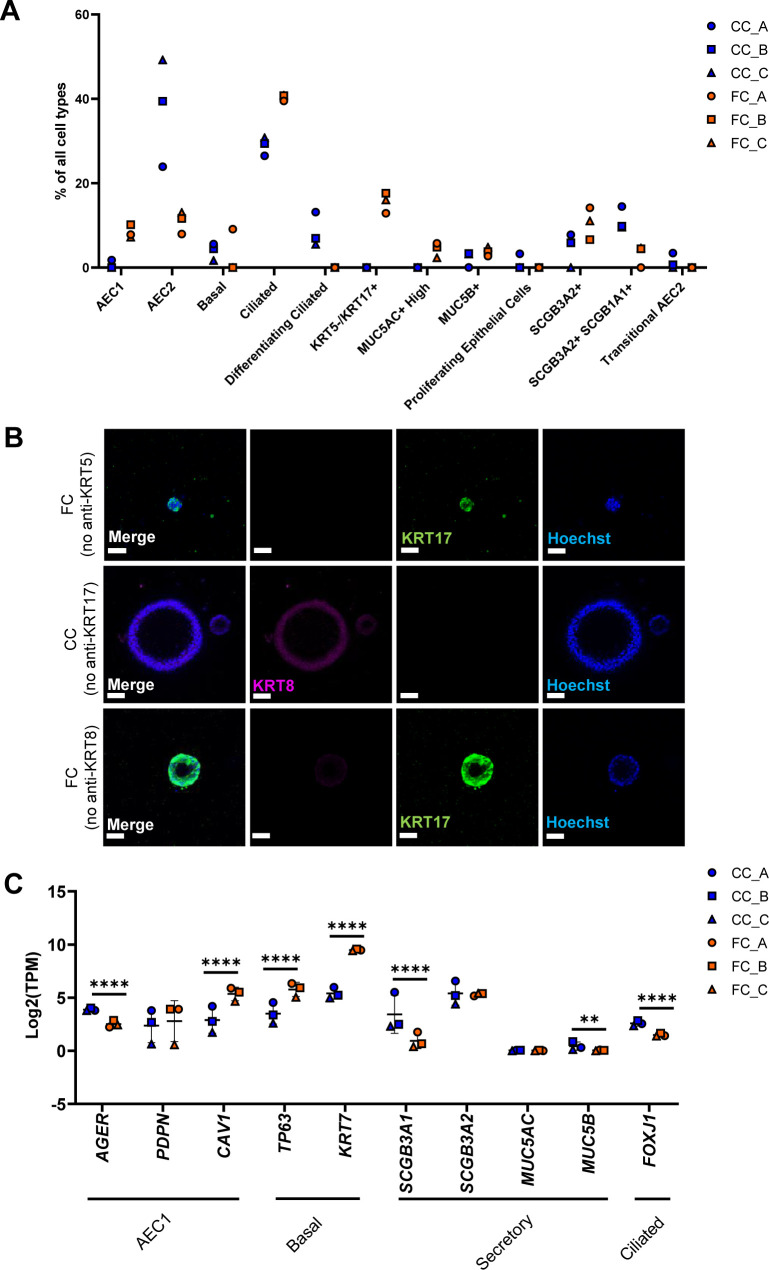
Figure S8. Deconvolution of RNA-seq data from alveolospheres stimulated with the fibrosis cocktail.
Related to Fig 4. (A) All epithelial cell proportion estimates by Bisque in CC-stimulated or FC-stimulated alveolospheres. n = 3 batches of alveolospheres. (B) Immunofluorescence of alveolospheres stimulated with CC or FC. No anti-KRT5, anti-KRT17, and anti-KRT8 as negative controls. Scale bar = 50 μm. (C) Expression of selected epithelial genes specific for AEC1, basal, secretory, and ciliated cells. Data presented as means ± SD. **** = P(adj) < 0.0001, ** = P(adj) < 0.01. n = 3 batches of alveolospheres.

