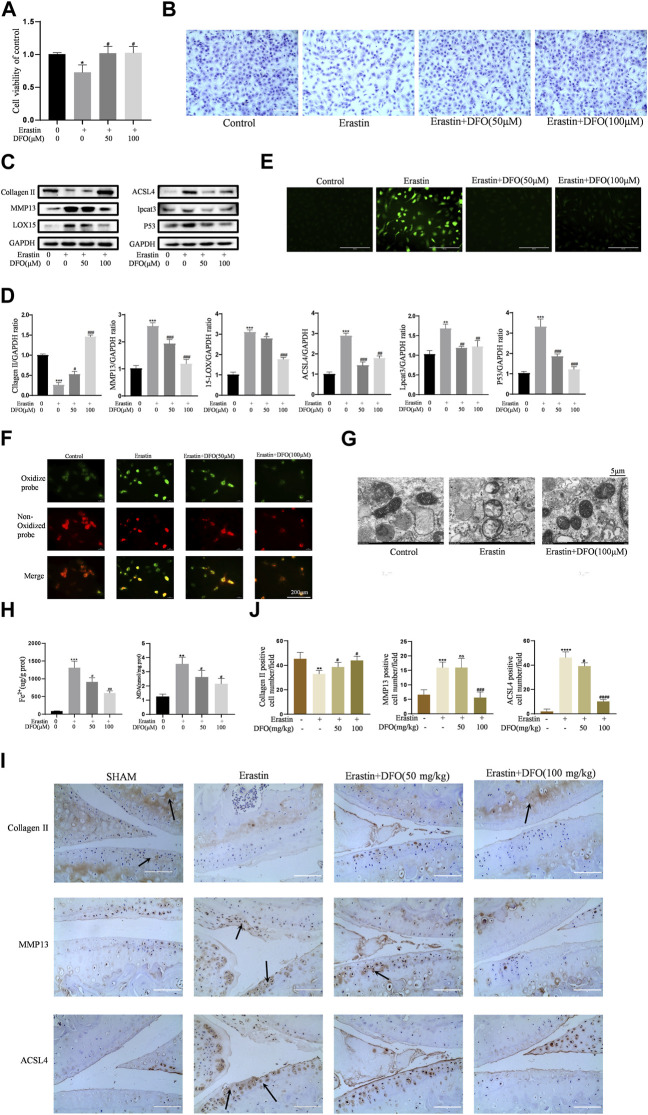
FIGURE 5.
DFO alleviated chondrocytes ferroptosis and OA progress induced by erastin. (A,B) Cell viability determined by CCK-8 assay and toluidine blue staining. (C,D) The protein expression levels of collagen Ⅱ, MMP13, ACSL4, LOX15, lpcat3, and P53 when treated by Erastin (5 μM) with 50 and 100 μM DFO or equa volume of DMSO were detected by Western blot, and band density ratios of collagen Ⅱ, MMP13, ACSL4, LOX15, lpcat3, and P53 to GAPDH in the Western blots were quantified by densitometry (n = 3). (E) Intracellular ROS level detected by DCFH-DA fluorescent probe (scale bar: 200 µm). (F) Intracellular lipid-ROS level detected by C11 BODIPY fluorescent probe (scale bar: 200 µm). Red, reduced form of C11-BODIPY; green, oxidized form of C11-BODIPY. (G) The ultrastucture of mitochondria observed via transmission electron microscopy (scale bar: 5 µm). (H) The intracellular level of MDA and Fe2+ was determined using the MDA assay kit and iron assay kit n = 3). (I) The collagen Ⅱ, MMP13, and ACSL4 expression levels in the cartilage samples were measured using immunohistochemistry staining. Dotted arrows indicate positive cells for MMP13 and ACSL4 and positive staining of collagen Ⅱ (scale bar: 100 µm). (J) Quantification of MMP13- and ACSL4-positive cells and collagen Ⅱ–positive staining in vivo. *p < 0.05 versus control or the sham group, **p < 0.01 versus control or the sham group, ***p < 0.001 versus control or the sham group, ****p < 0.0001 versus control or the sham group, #p < 0.05 versus IL-1β–treated group or the DMM group, ##p < 0.01 versus IL-1β–treated group or the DMM group, ###p < 0.001 versus IL-1β–treated group or the DMM group, and ####p < 0.0001 versus IL-1β–treated group or the DMM group. Error bars represent SD.

