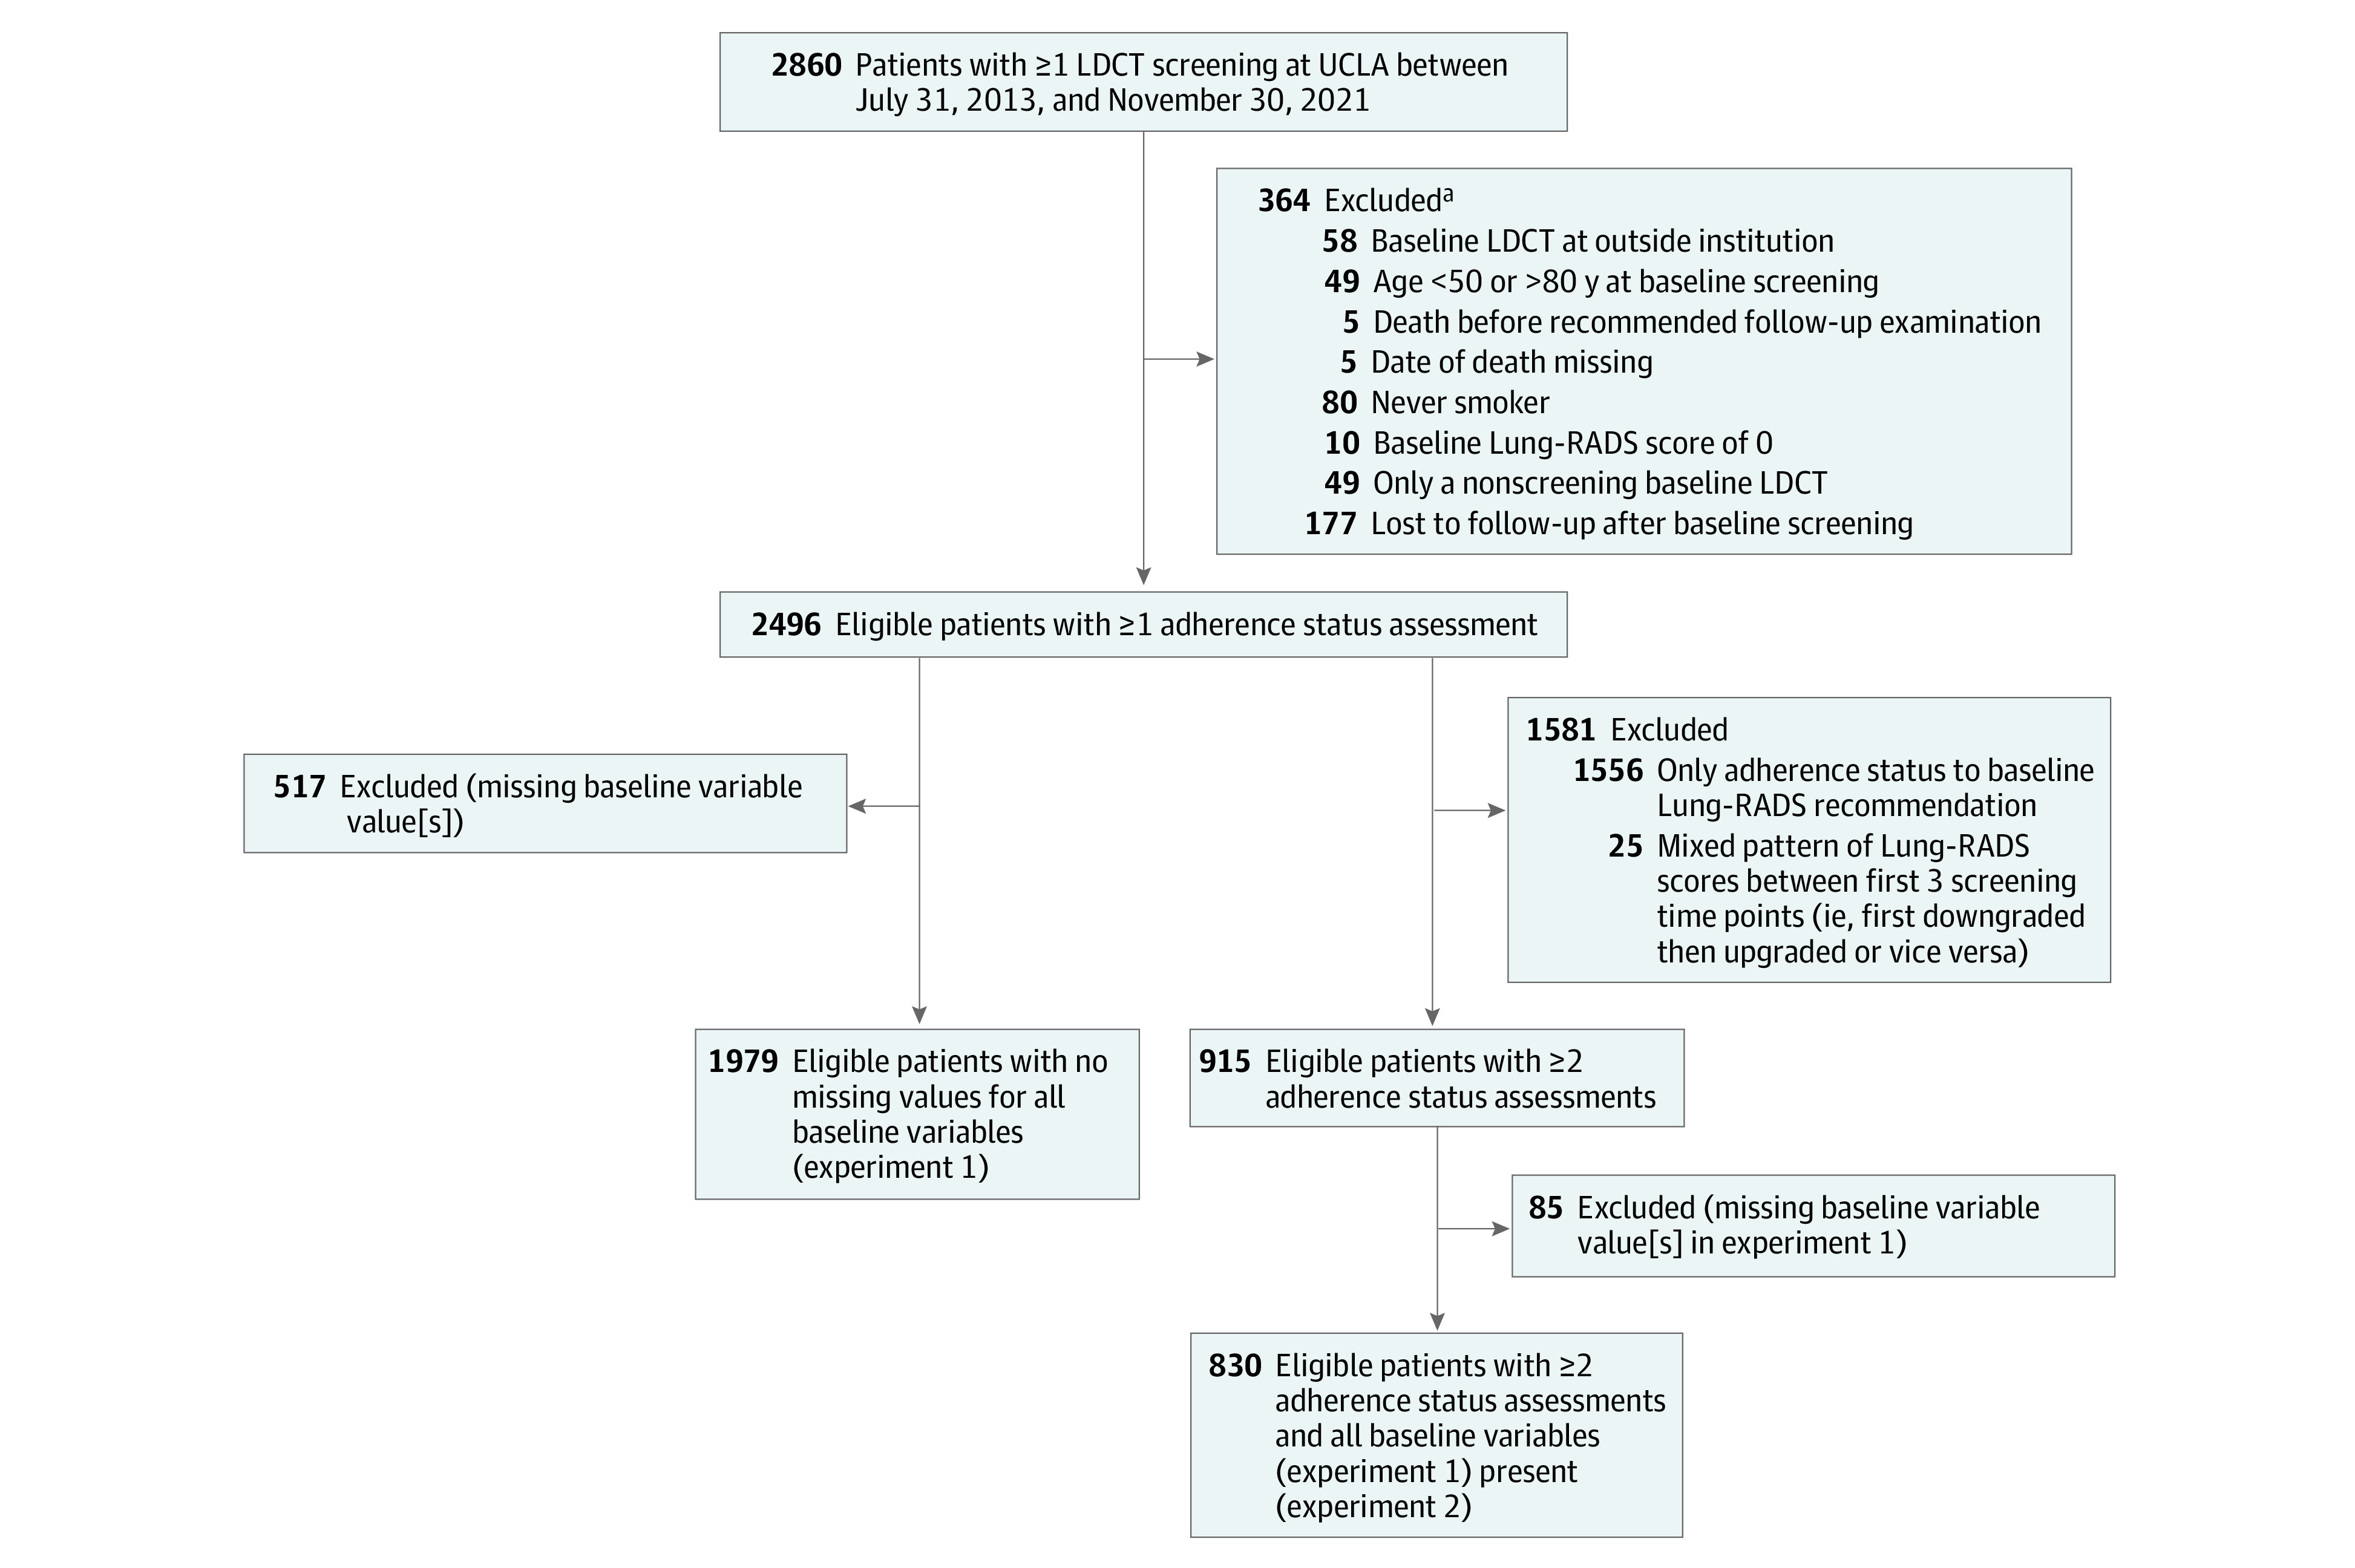
Figure. Flow Diagram of Patient Enrollment.

The last follow-up was December 8, 2021. CT indicates computed tomography; LDCT, low-dose CT; Lung-RADS, Lung CT Screening Reporting & Data System; UCLA, University of California, Los Angeles.
aA patient could have more than 1 exclusion criterion.
