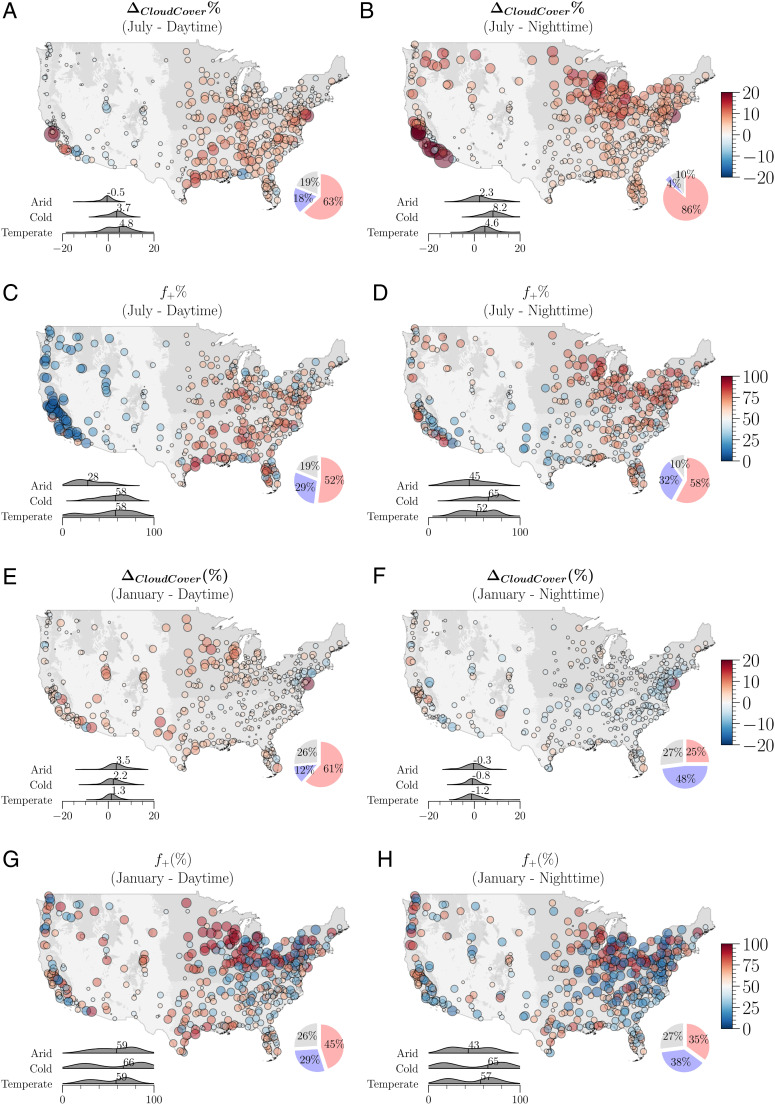
Fig. 3.
Spatial variations of urban-modified cloud cover (ΔCloudCover) and frequencies (f+) across CONUS diurnally and seasonally, for July (A–D) and January (E–H). Each circle represents a city. Its color indicates the intensity of the estimated variable, and its size is proportional to |ΔCloudCover| or |f+ − 50%|. A distribution comparison among three climate regions (arid, cold, and temperate) is shown in the Lower Left corner as density curves, and the median value for each region is labeled. The ratios of studied cities with +ΔCloudCover (f+ > =50%) are shown in red and −ΔCloudCover (f+ < 50%) in blue at the lower right corner for cities with significant ΔCloudCover at P = 0.05 level. The ratios of studied cities with insignificant results are shown in gray.

