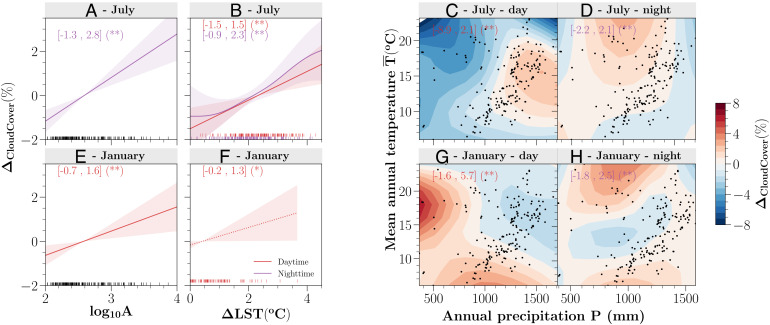
Fig. 4.
Estimated effects of local and regional properties on local cloud patterns in GAMs for inland cities in July and January. The effects of city size [log10A, in log10(km2)] (A and E), surface heating (ΔLST, in ° C) (B and F), and regional climate (P, in mm and , in ° C) (C, D, G, and H) are shown. The standard errors of combined effects P & can be found in SI Appendix, Fig. S15. Only statistically significant results are illustrated: dashed lines for P = 0.05 level (*) and solid lines for P = 0.01 level (**). The shaded regions indicate 2 standard errors predicted by each factor. The minimum and maximum estimated effects and the significant level on ΔCloudCover (%) of all studied cities are labeled in brackets for day and night, respectively. The vertical bars at the bottom in A, B, E, and F suggest the sampled cities. Black dots are shown for the locations of cities (C, D, G, and H). Note that the estimated results show only +ΔLST values (B and F). The log-scale inland city size ranges from 1.95 (Manhattan, Kansas) to 4.02 (Atlanta, Georgia) in log10A (A and E). Only cities with significant ΔCloudCover at P = 0.05 level are analyzed.

