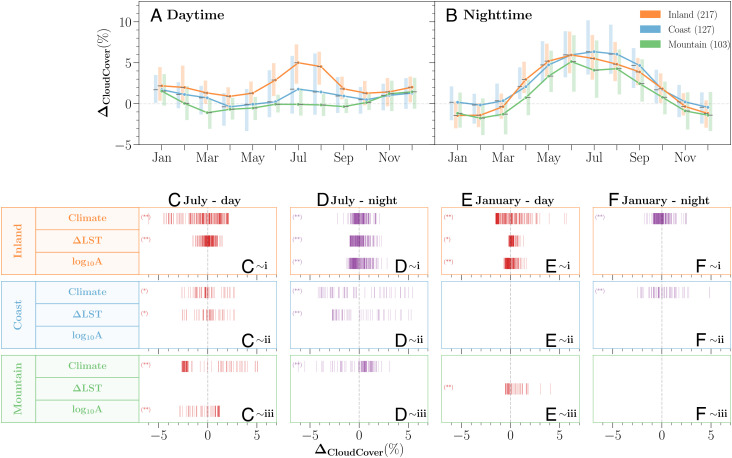
Fig. 5.
(A and B) Seasonal and diurnal variations of urban-modified cloud patterns ΔCloudCover summarized in three geographical regions and (C–F) summary of estimated effects of local [city size (log10A) and surface heating (ΔLST)] and regional (regional climate, P and ) effects on the spatial variations of urban cloud anomalies for inland (i), coastal (ii), and mountainous (iii) cities. Boxes show the median (solid line) and interquartile range of ΔCloudCover. (C–F) Statistically significant results are illustrated with P = 0.05 (*) and P = 0.01 (**) levels. Vertical bars represent the estimated effect of the studied cities. Only cities with significant ΔCloudCover at P = 0.05 level are analyzed.

