
Fig. 1.
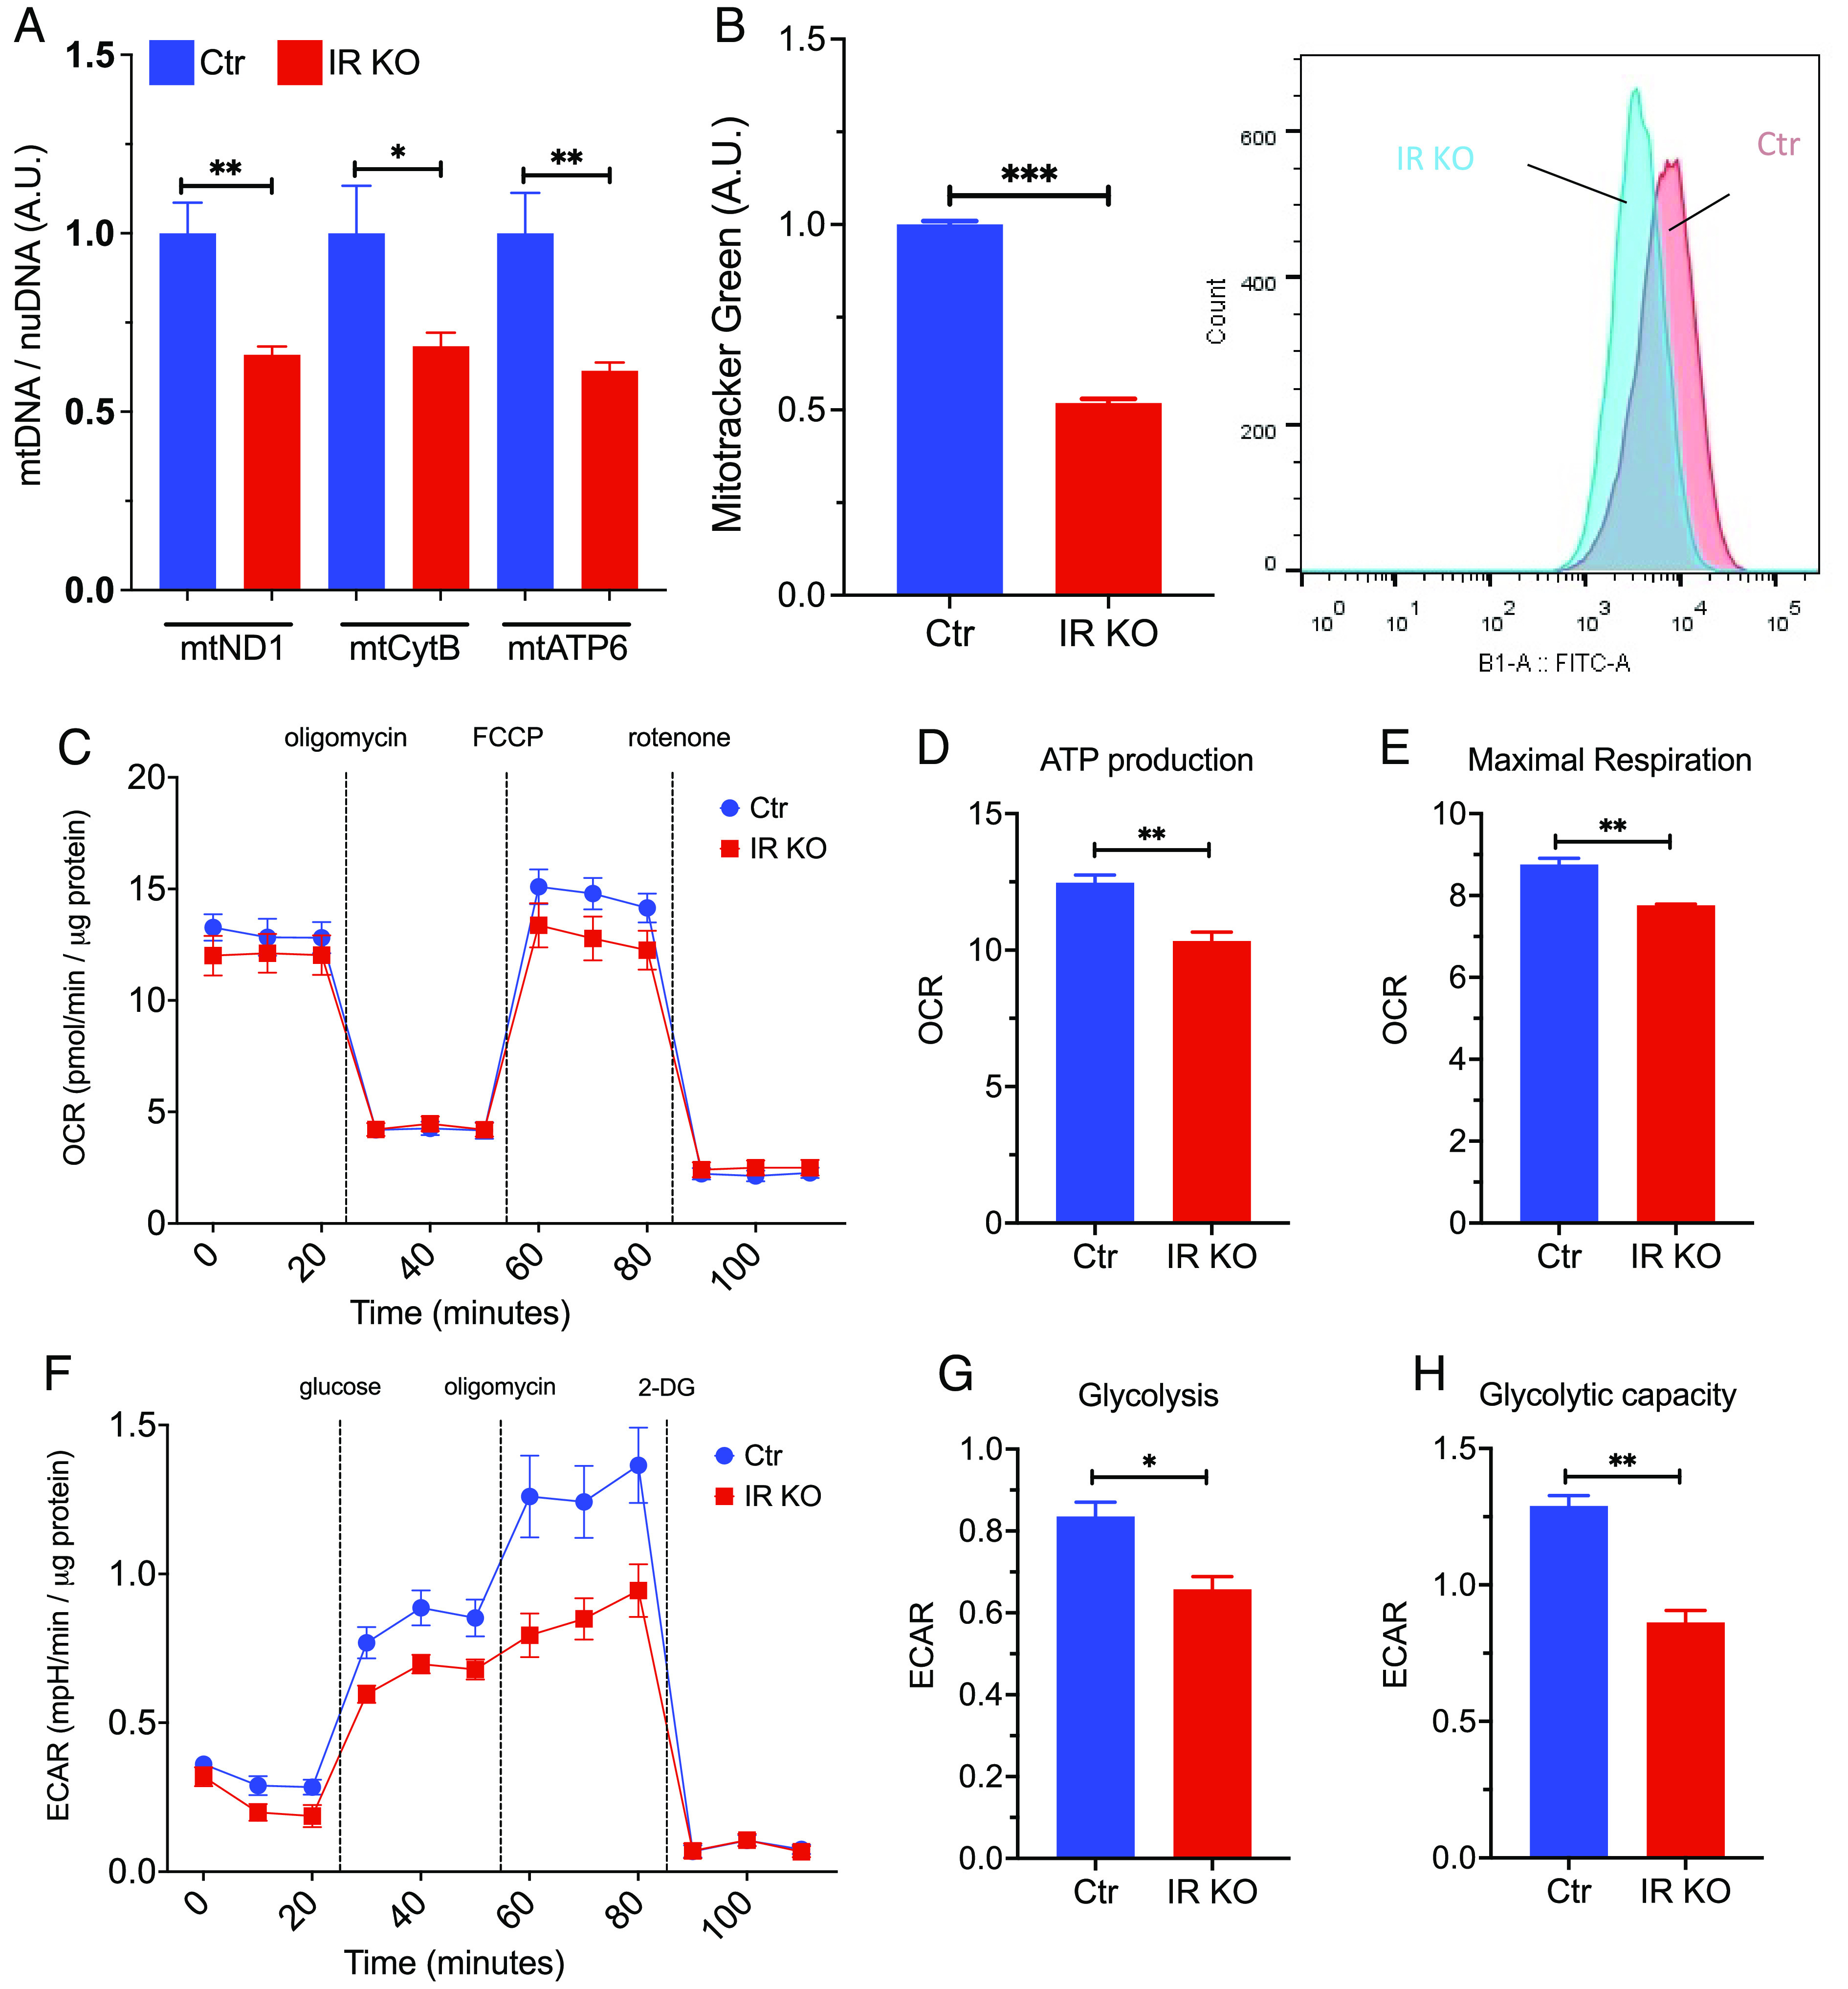
Loss of insulin signaling impairs mitochondrial respiration and glycolytic capacity in astrocytes. (A) qPCR analysis showing copy number of the mitochondrial DNA versus genomic DNA (mtND1, mtCytB, mtATP6) in control and IRKO astrocytes. N = 6. (B) Mean fluorescent intensity (MFI) in control and IRKO astrocytes loaded with mitotracker green and quantified by flow cytometry. N = 5. (C) OCR of control and IRKO astrocytes sequentially treated with oligomycin (2 µM), FCCP (2 µM), and rotenone (2.5 µM) was measured using a Seahorse X24 Bioanalyzer. All data were normalized to the protein content of the corresponding wells (N = 9 to 10). (D and E) Mitochondrial ATP production and maximal respiration of control and IRKO astrocytes were calculated from the Seahorse data (25) (N = 9 to 10). (F) ECAR of control and IRKO astrocytes sequentially treated with glucose (10 mM), oligomycin (2 µM), and 2-deoxyglucose (50 µM) was measured using a Seahorse X24 Bioanalyzer. All the data were normalized to the protein content of the corresponding wells (N = 10). (G and H) Glucose-induced glycolysis and maximal glycolic capacity of control and IRKO astrocytes (N = 10), *P < 0.05, **P < 0.01, ***P < 0.001, in an unpaired t test. Data are presented as mean ± SEM.