
Fig. 3.
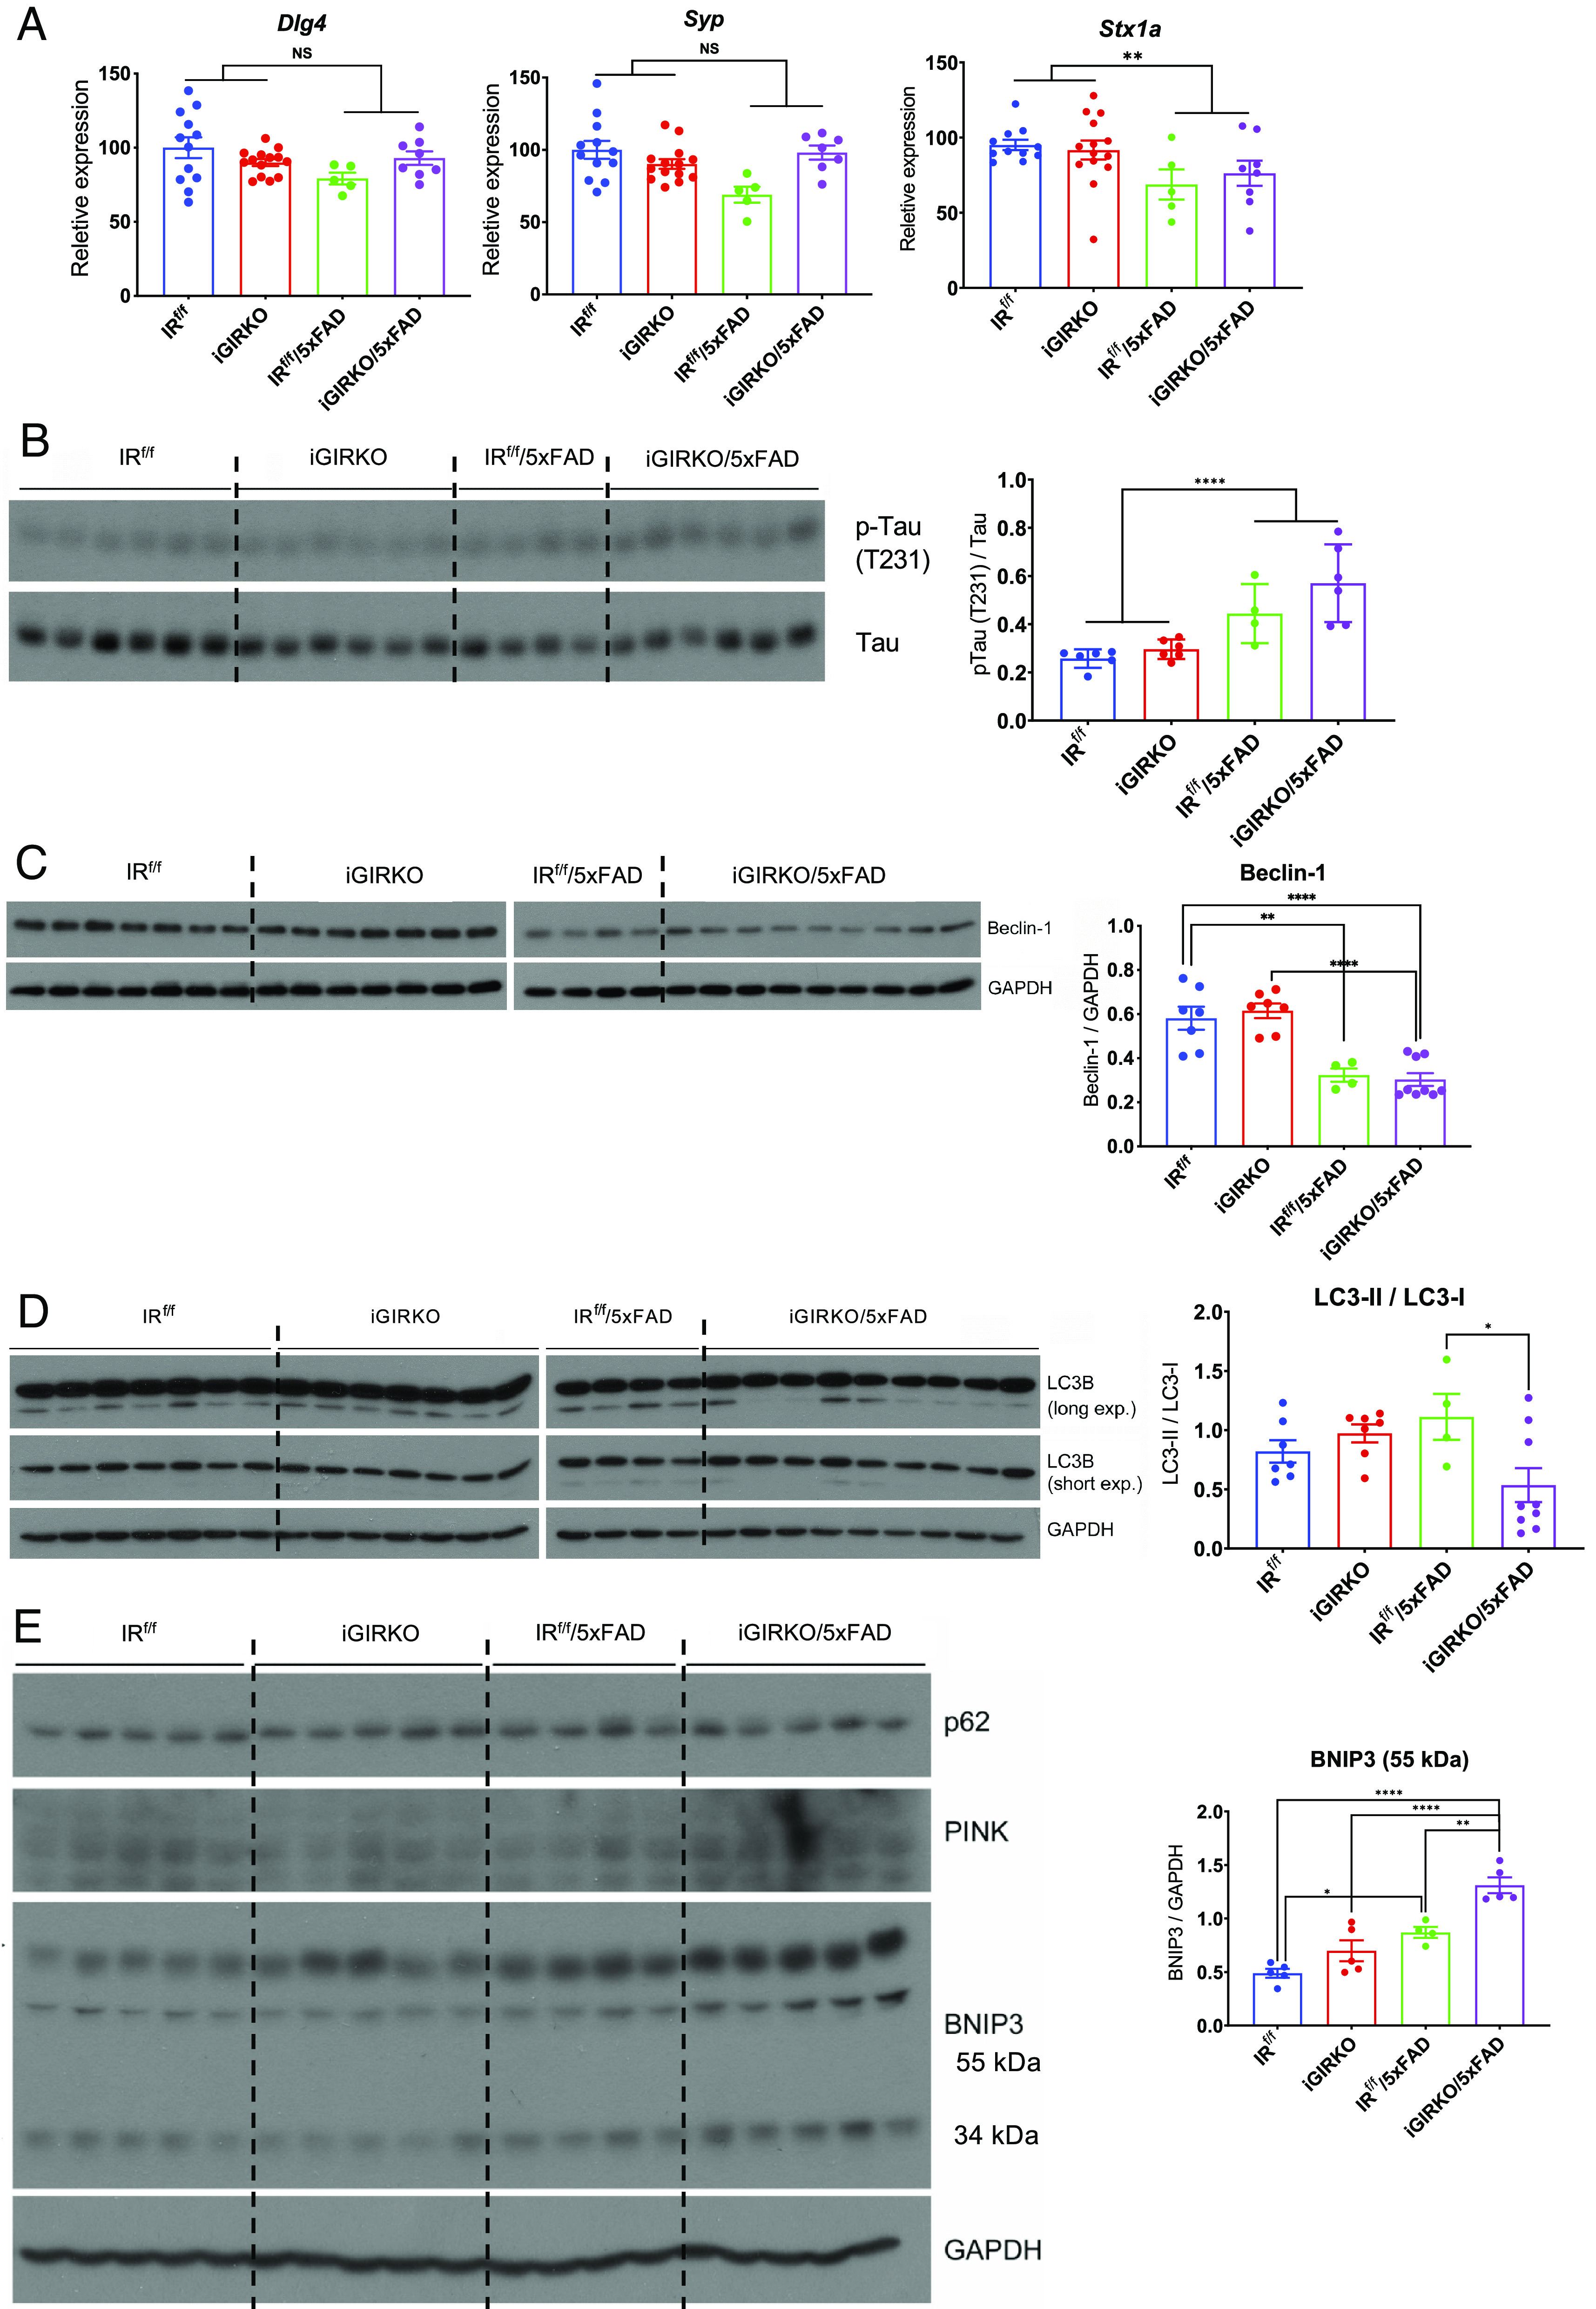
Loss of insulin signaling in astrocytes enhances Tau phosphorylation, mitophagy, and autophagy. (A) qPCR analysis of synaptic marker genes (Dlg4, Syp, Stx1a) in 8-mo-old male mouse cortex. N = 5 to 14 per condition. (B) Representative western blots and quantification of phosphorylated Tau proteins in protein extracted from the cortex of 6-mo-old male mice. N = 4 to 6 per condition. (C) Representative western blots and quantification of Beclin-1 in proteins extracted from the cortex of 6-mo-old male mice. N = 4 to 9 per condition. (D) Representative western blots and quantification of mitophagy pathway-related proteins LC3-I and LC3-II and ratio of LC3-II to LC3-I in protein extracted from the cortex of 6-mo-old male mice. N = 4 to 9 per condition. (E) Representative western blots and quantification of autophagy marker proteins BNIP3 in protein extracted from the cortex of 6-mo-old male mice. N = 4 to 5 per condition. *P < 0.05, **P < 0.01, ***P < 0.001, ****P < 0.0001 by two-way ANOVA analysis followed by Tukey’s multiple comparisons test. Quantitative data are presented as mean ± SEM.