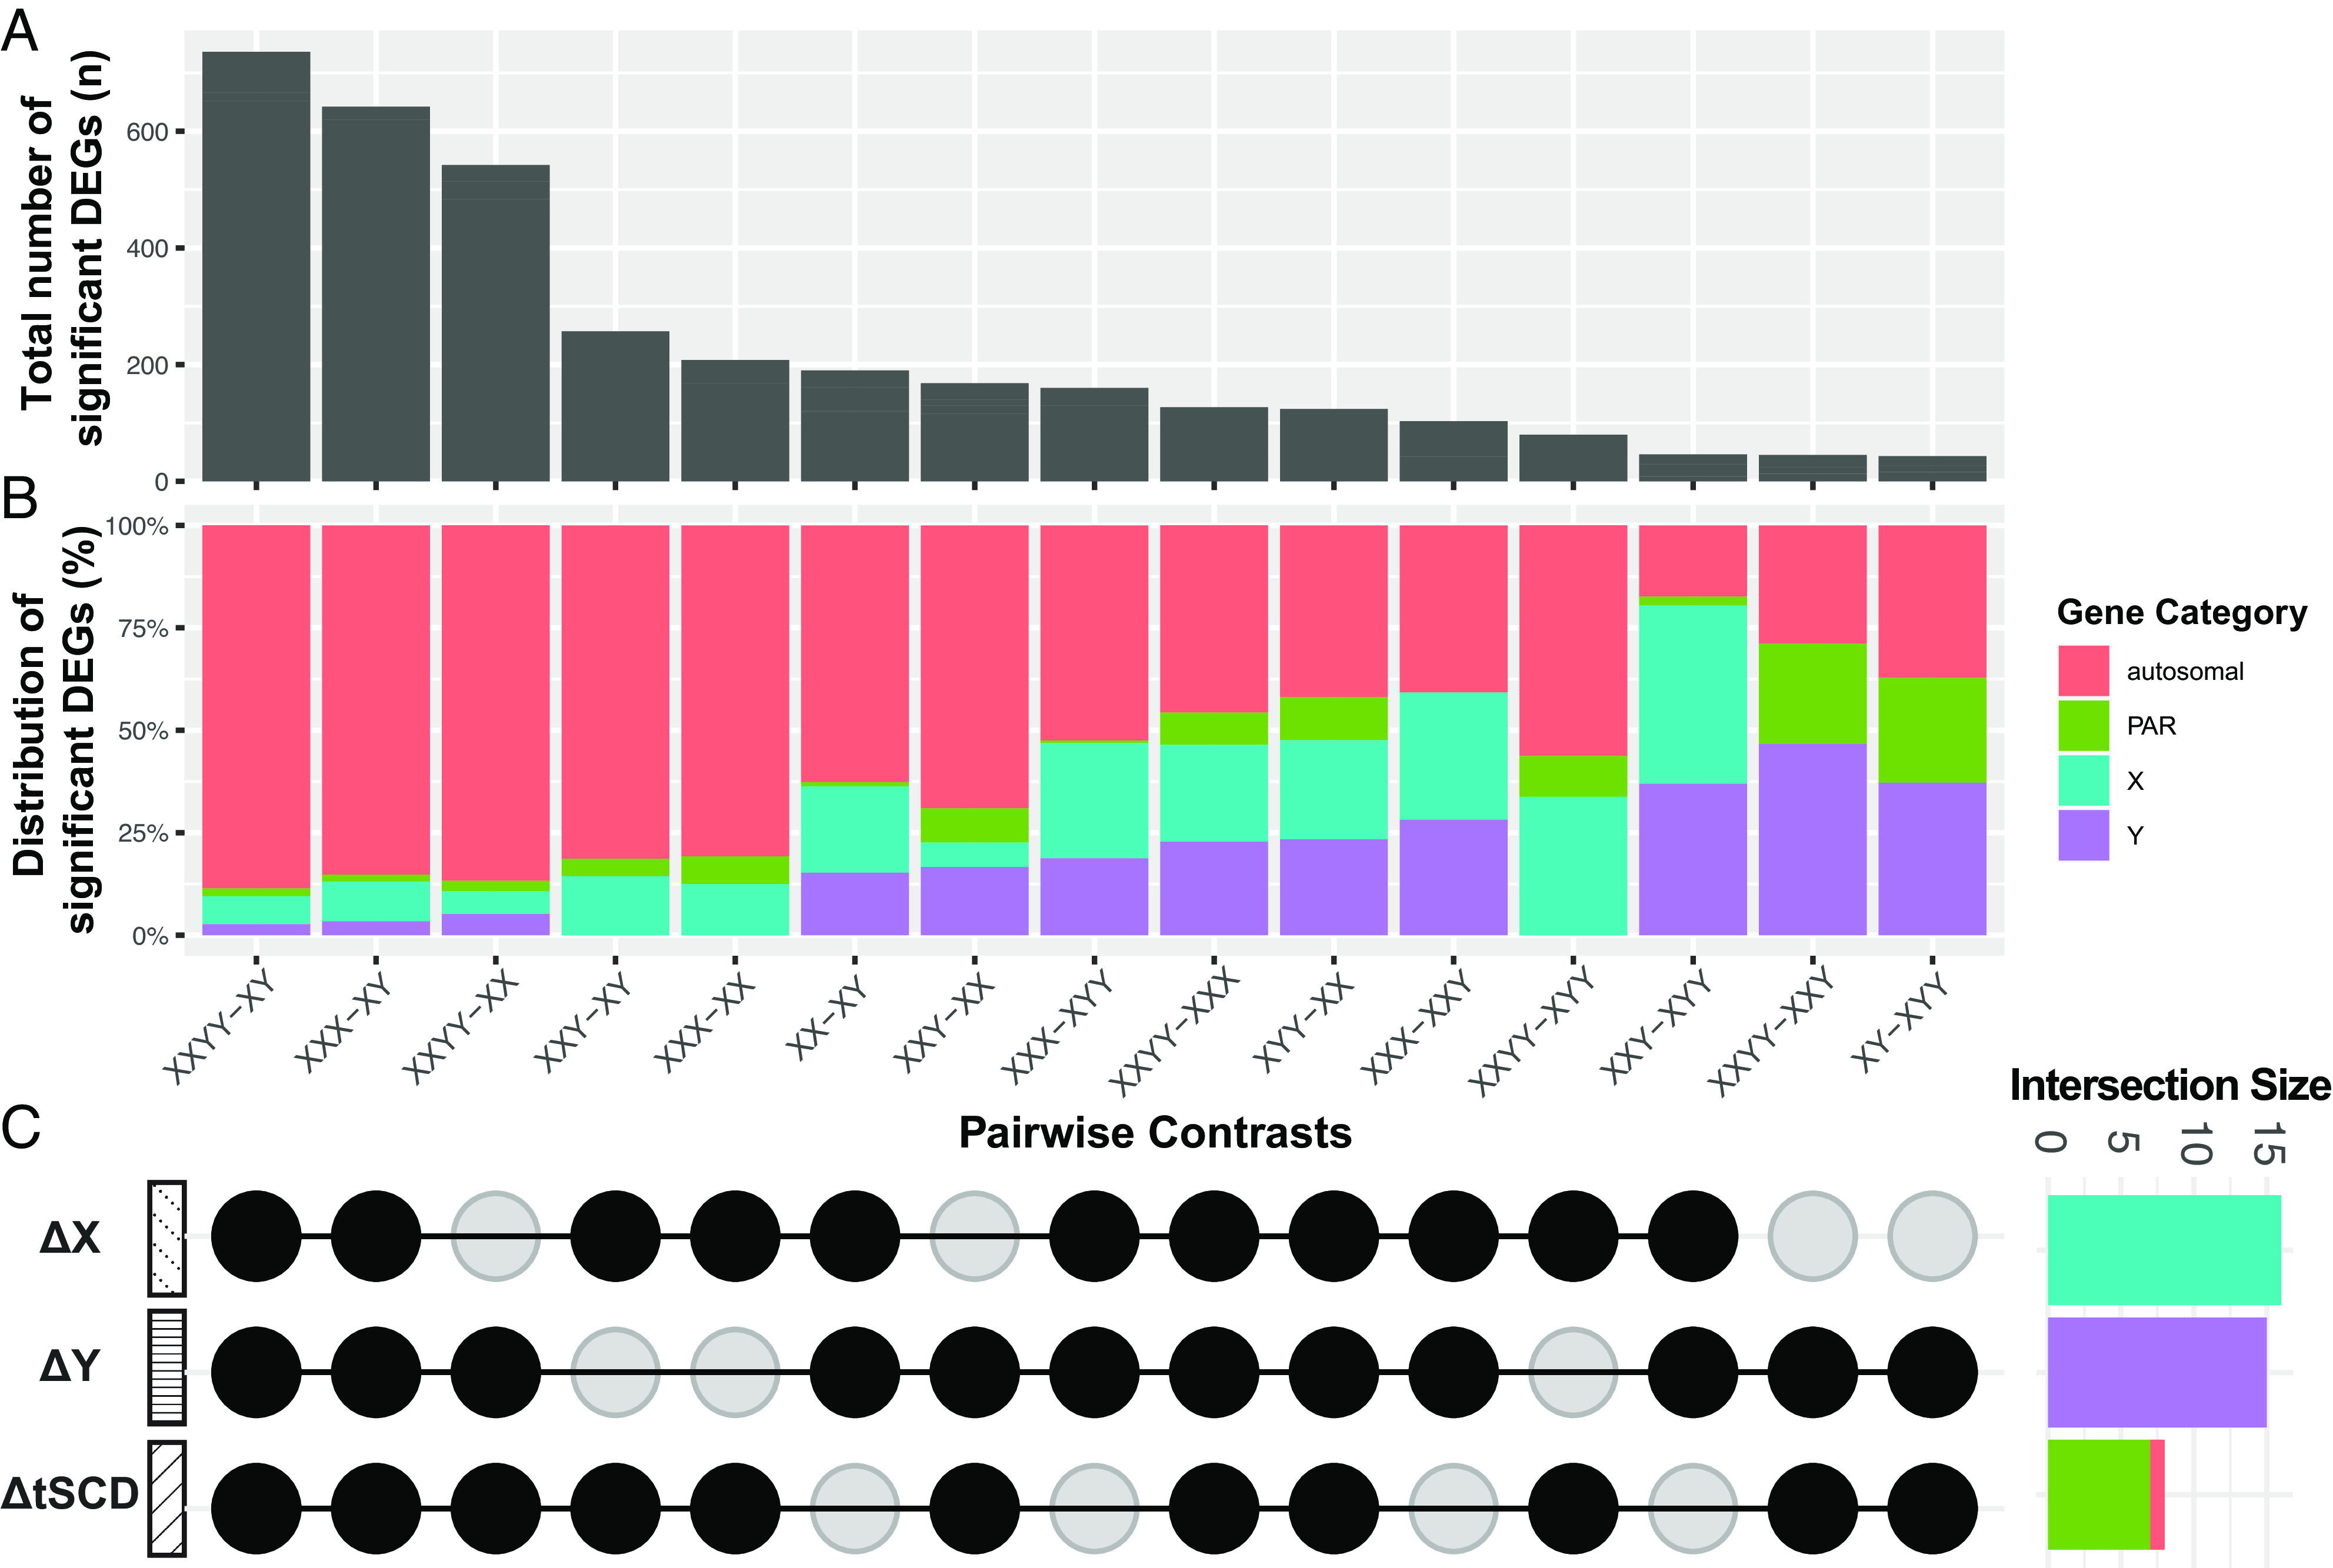
Fig. 2.

Distribution of differentially expressed genes (DEGs) across pairwise sex chromosome dosage (SCD) group contrasts in lymphoblastoid cell lines (LCLs). (A) Bar chart showing the total number of DEGs in each group contrast (False-discovery rate q < 0.05; full DEG list Dataset S1), (B) Stacked bar chart showing the proportion of DEGs in each contrast by chromosome of origin: autosomal, PAR, X and Y (X- and Y-specific nonPAR). (C) Upset plot showing which SCD group contrasts capture each of the 3 main modes of SCD variation: changes in X chromosome dosage (ΔX), Y chromosome dosage (ΔY), and total SCD (ΔtSCD). Side panel bar chart for the number of DEGs shared across all group contrasts in each mode of SCD variation. The genes specified by these intersection sets therefore show obligate dosage sensitivity (ODS) to each mode of SCD variation (ODS genes listed in Tables 1–3).
