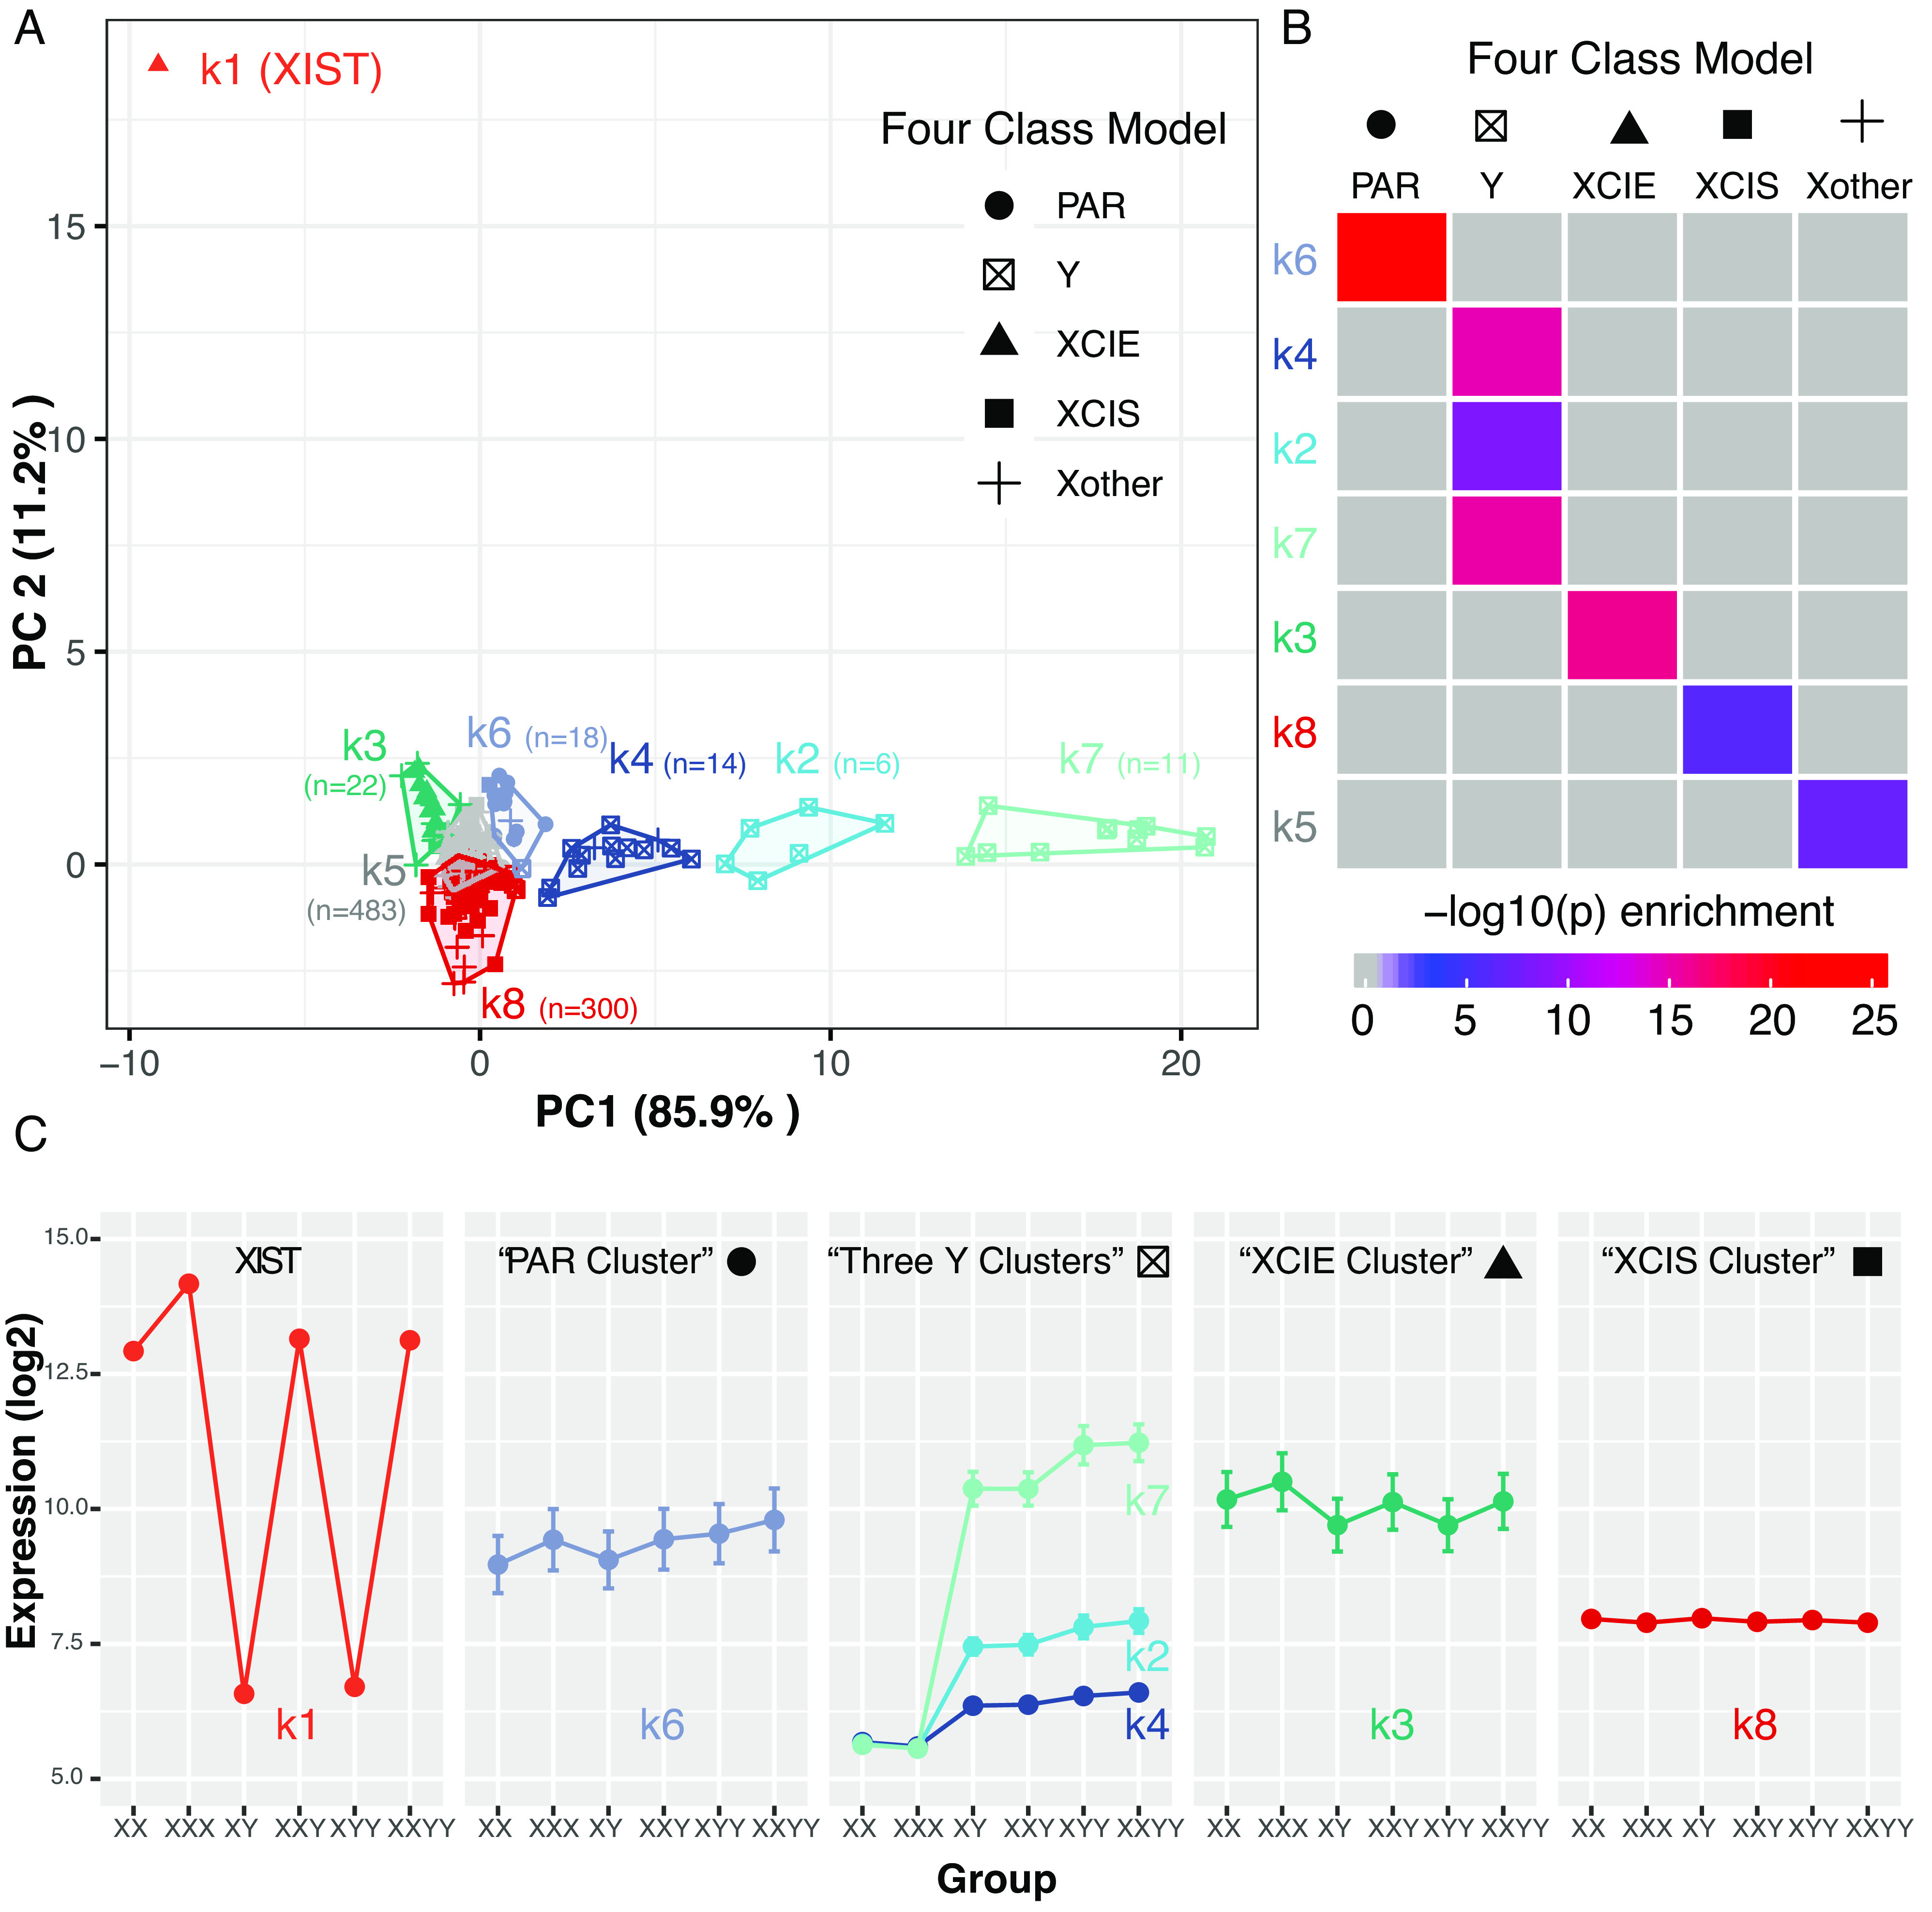
Fig. 3.

Clustering sex-chromosome genes by sex chromosome dosage (SCD) sensitivity in lymphoblastoid cell lines (LCLs). (A) A total of 855 sex chromosome genes (points) were k-means clustered based on their profiles of mean expression across 6 SCD groups (k = 8 selection by scree plot in SI Appendix, Fig. S4). Genes are plotted by their scores on the first 2 principal components (PCs) of the gene*group mean expression matrix. Cluster designation is encoded by the color of points and cluster boundaries. Point shape encodes assigned gene class according to the theoretical Four Class Model of SCD sensitivity [Pseudoautosomal Region (PAR); Y-linked; X-linked genes that escape XCI (XCIE), are subject to XCI (XCIS), and have no clear XCI status (Xother)]. (B) Heatmap of pairwise Fisher’s exact tests for overlaps between gene sets in k-means cluster and Four Class Model categories. All P-values shown in color survive Bonferroni correction. (C) Average expression of genes in each k-means cluster across SCD groups.
