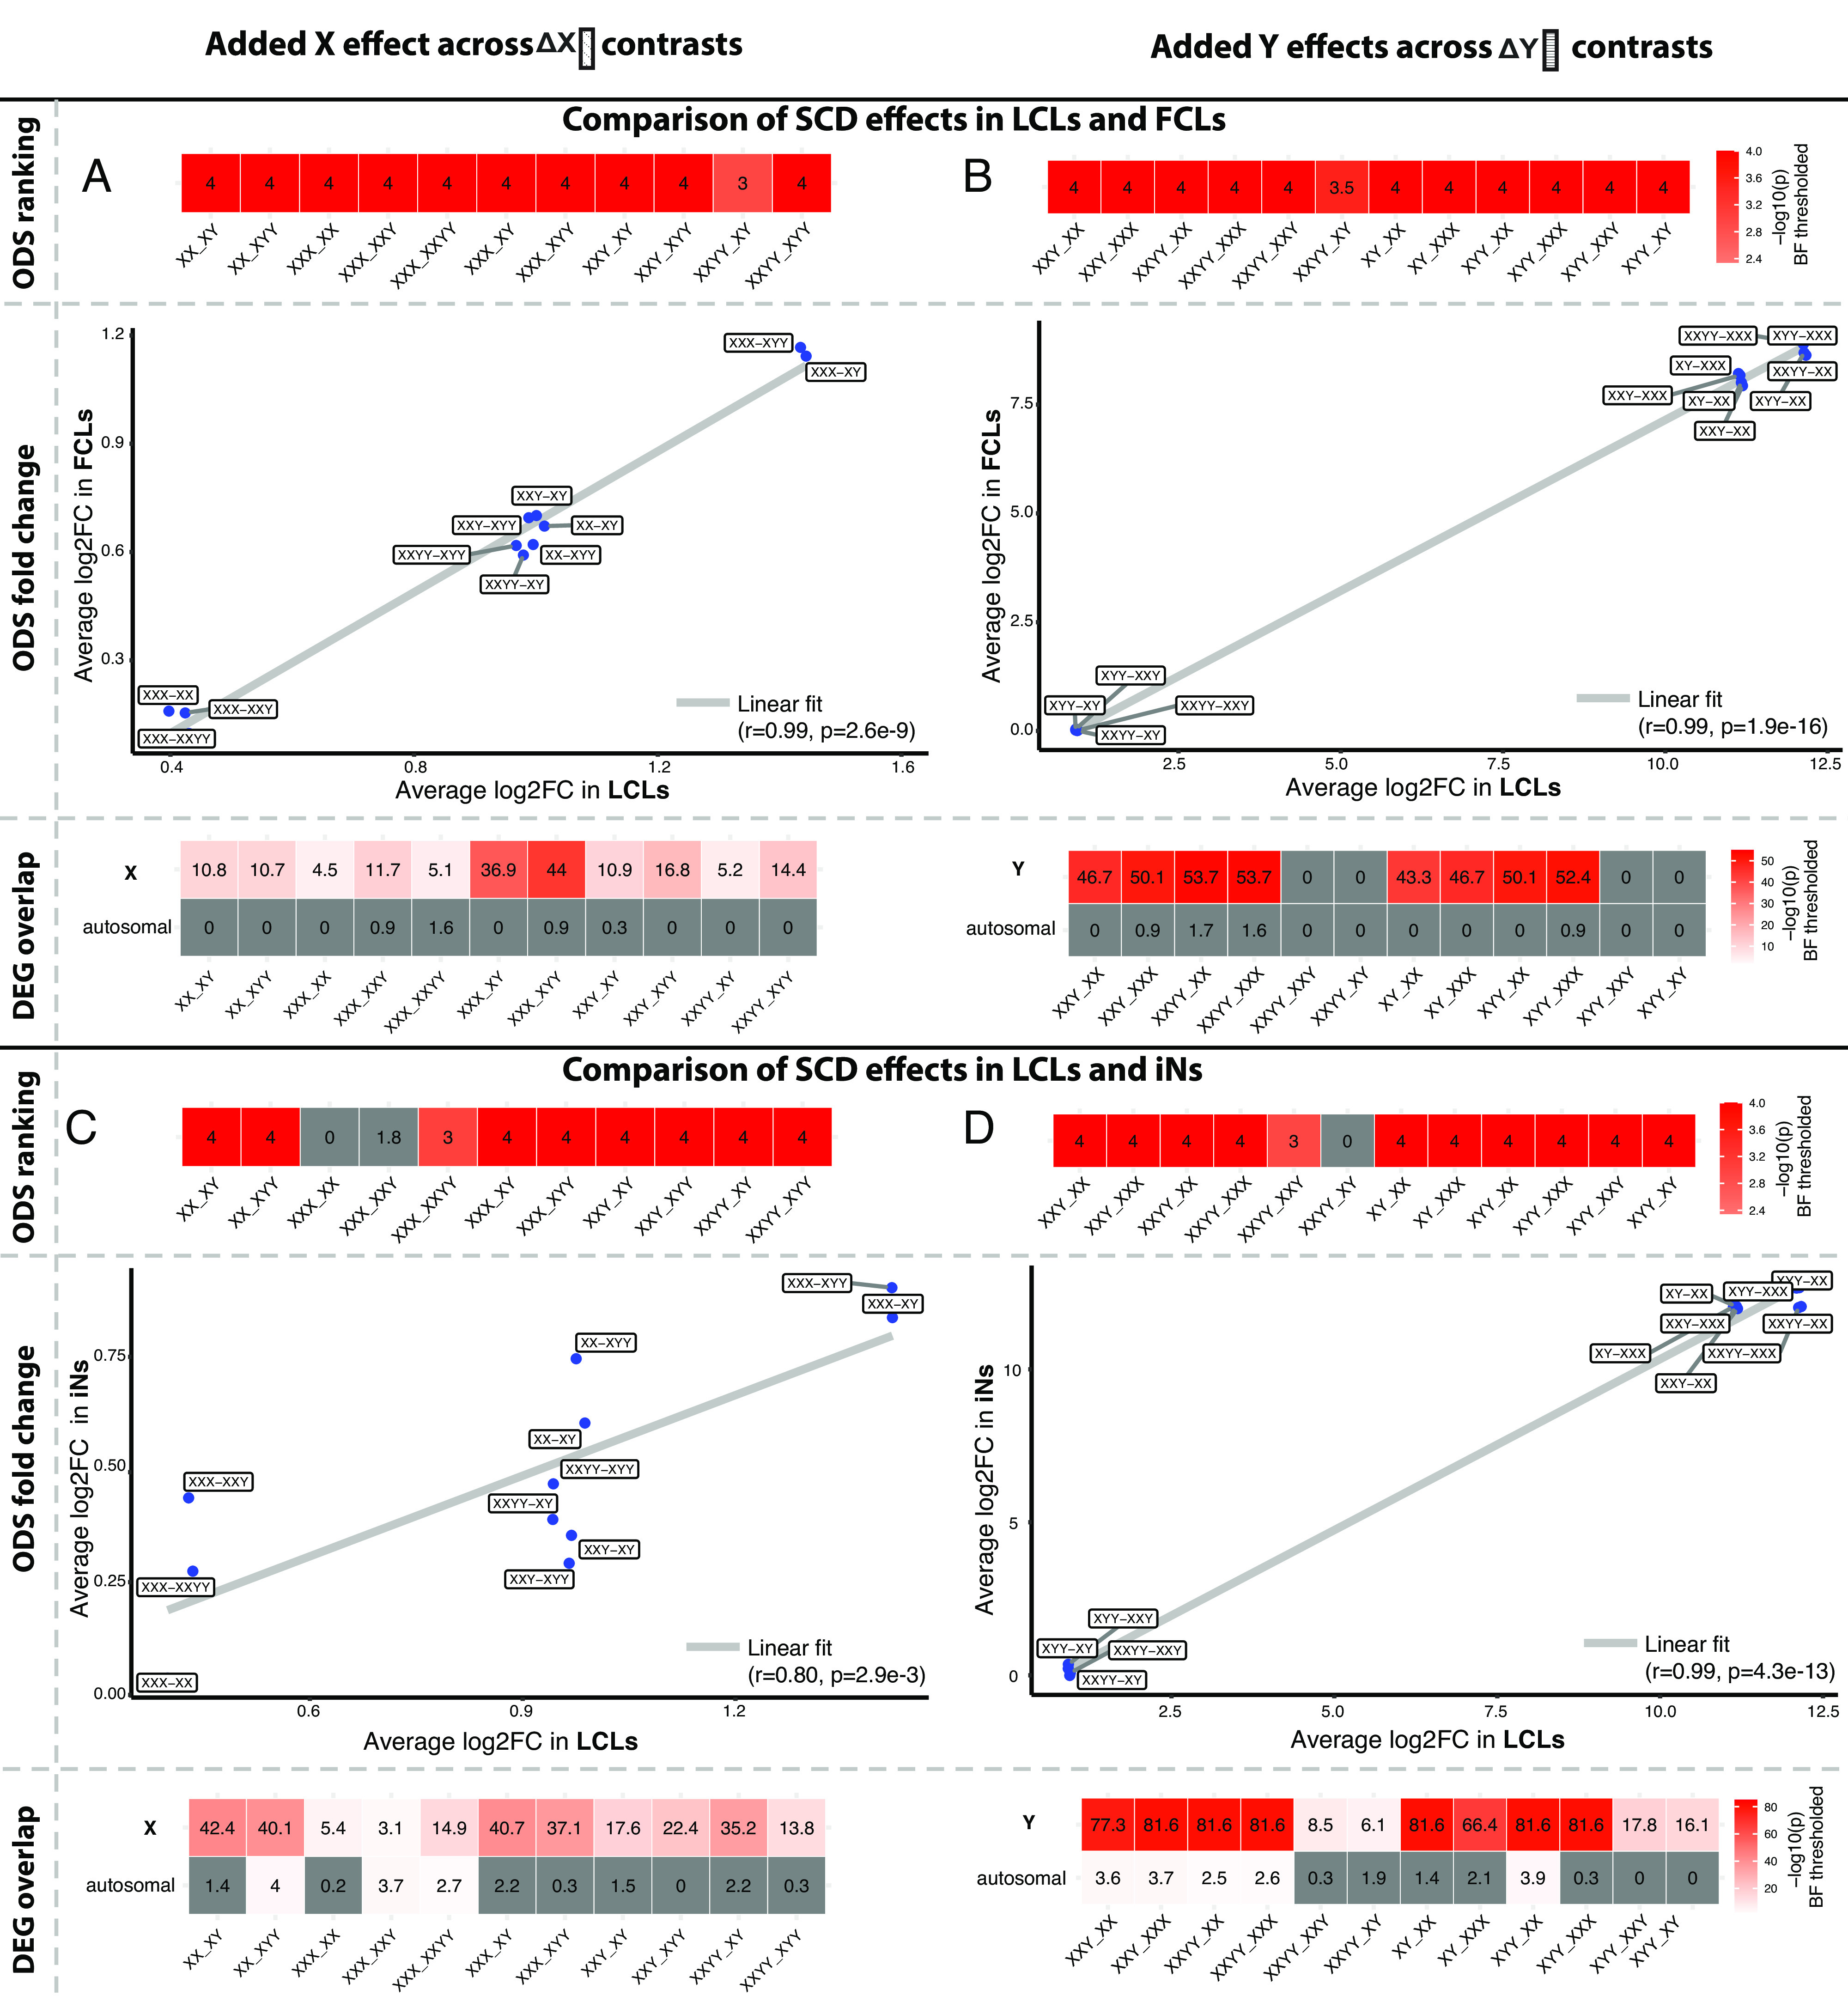
Fig. 4.

Generalizability of sex chromosome dosage (SCD) effects on gene expression in lymphoblastoid cell lines (LCLs) to fibroblasts (FCLs) and induced neurons (iNs). Results are shown separately for the LCL-FCL comparison (A and B) and the LCL-iN comparison (C and D), and separately for X chromosome dosage (XCD, A and C) and Y chromosome dosage (YCD, B and D) effects. In each panel: The upper 1-row heatmap shows contrast-specific P-values for a rank-based permutation test that asks whether ODS genes for that contrast in LCLs show extreme log2FC values in the non-LCL tissue type; the middle scatterplot correlates the mean log2FC of ODS genes for each contrast in LCLs vs. the mean log2FC of these genes from the equivalent contrast in the non-LCL tissue type; and, the lower heatmap shows the result of Fisher’s exact tests comparing differentially expressed genes (DEGs) for each SCD contrast in LCLs to those in the non-LCL tissue type—stratified by whether or not the DEGs reside on a sex-chromosome. All P-values shown in color survive Bonferroni correction. Of note, the consistency of cis effects between LCLs and iNs shown in XCD contrasts of panel C was also recovered in a sensitivity analysis that excluded 2 iN samples with potential markers of XCI erosion (SI Appendix, Text S3.2 and Fig. S9).
