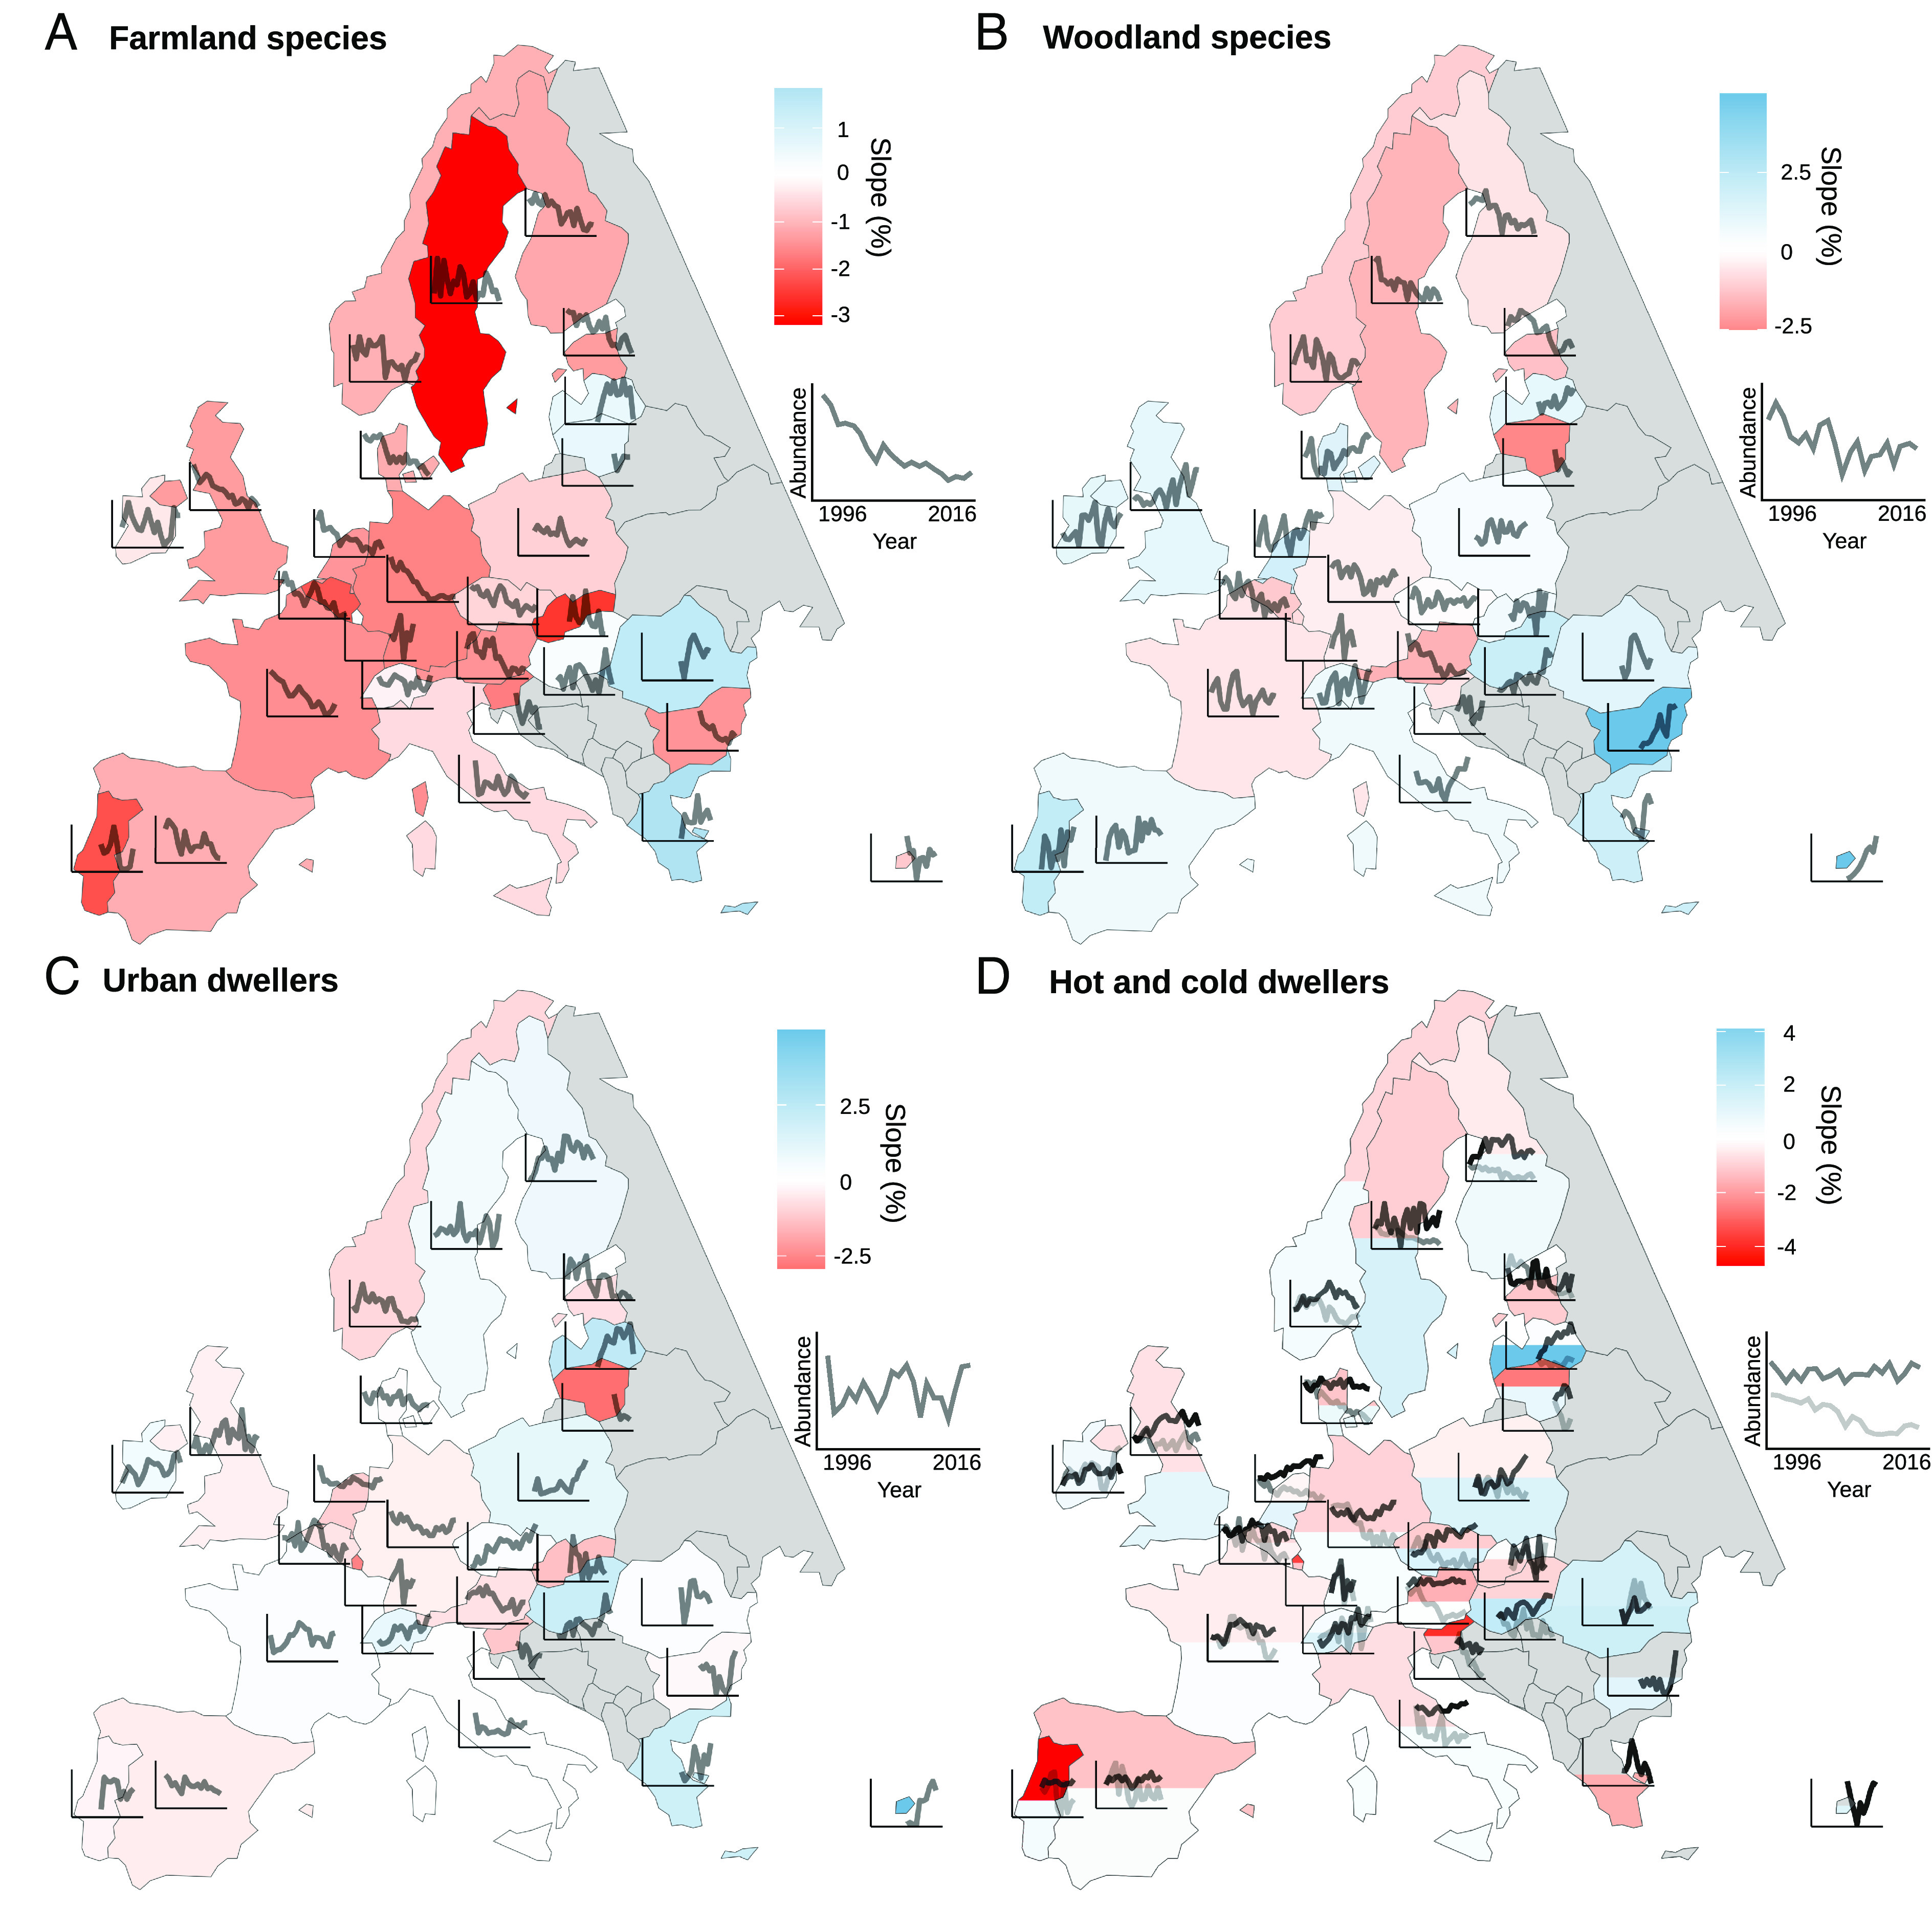
Fig. 1.

Temporal change in bird abundance in Europe between 1996 and 2016 for countries participating in the PanEuropean Common Bird Monitoring Scheme (PECBMS) (n = 28, non-PECBMS countries in gray). For each country, the color represents the slope (red for decline, blue for increase) and the black line corresponds to the time series of the multispecies index (MSI) between 1996 and 2016 (species lists by country in SI Appendix, Appendix 5). (A) Change in abundance of farmland species (MSI by country on 19 species) showing an overall sharp while decelerating decline. (B) Change in abundance of woodland species (MSI by country on 25 species) showing an overall linear decline. (C) Change in abundance of urban dwellers (MSI by country on 22 species) showing an overall stable trajectory. (D) Change in abundance of cold dwellers (light gray, MSI by country on 35 species) showing an overall linear decline. Change in abundance of hot dwellers (dark gray, MSI by country on 35 species) showing an overall stable trajectory. Color for hot dweller trends on the southern part of countries and color for cold dwellers on the northern part of countries.
