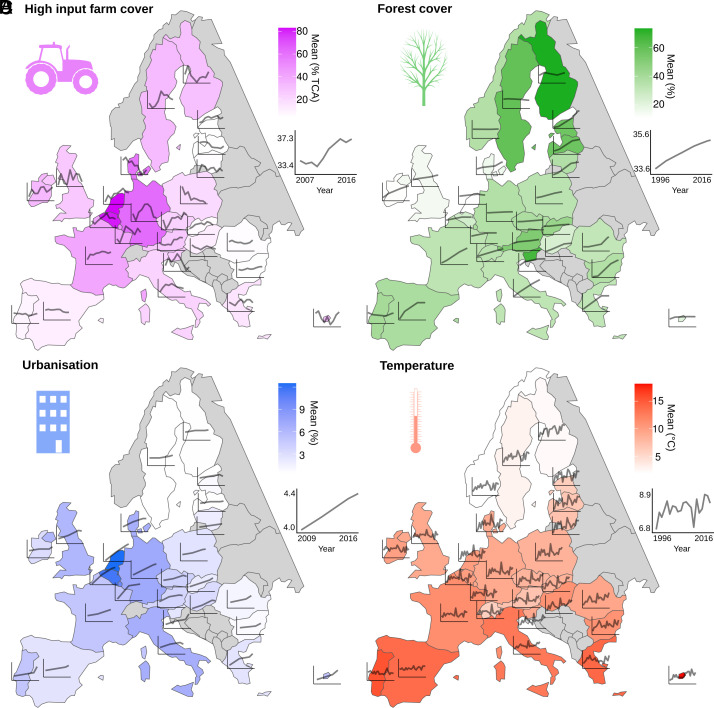
Fig. 2.
Anthropogenic pressures for countries participating in the PanEuropean Common Bird Monitoring Scheme (PECBMS) (n = 28, non-PECBMS countries and countries with no available data in gray). For each country and each pressure, the color represents the mean and the black line corresponds to the time series. (A) High-input farm cover (% of total cultivated area covered by high-input farms), period covered by data 2007 to 2016. (B) Forest cover (% of the country’s surface), 1996 to 2016. (C) Urbanization (% of the country’s surface), 2009 to 2016. (D) Temperature (°C), 1996 to 2016.

