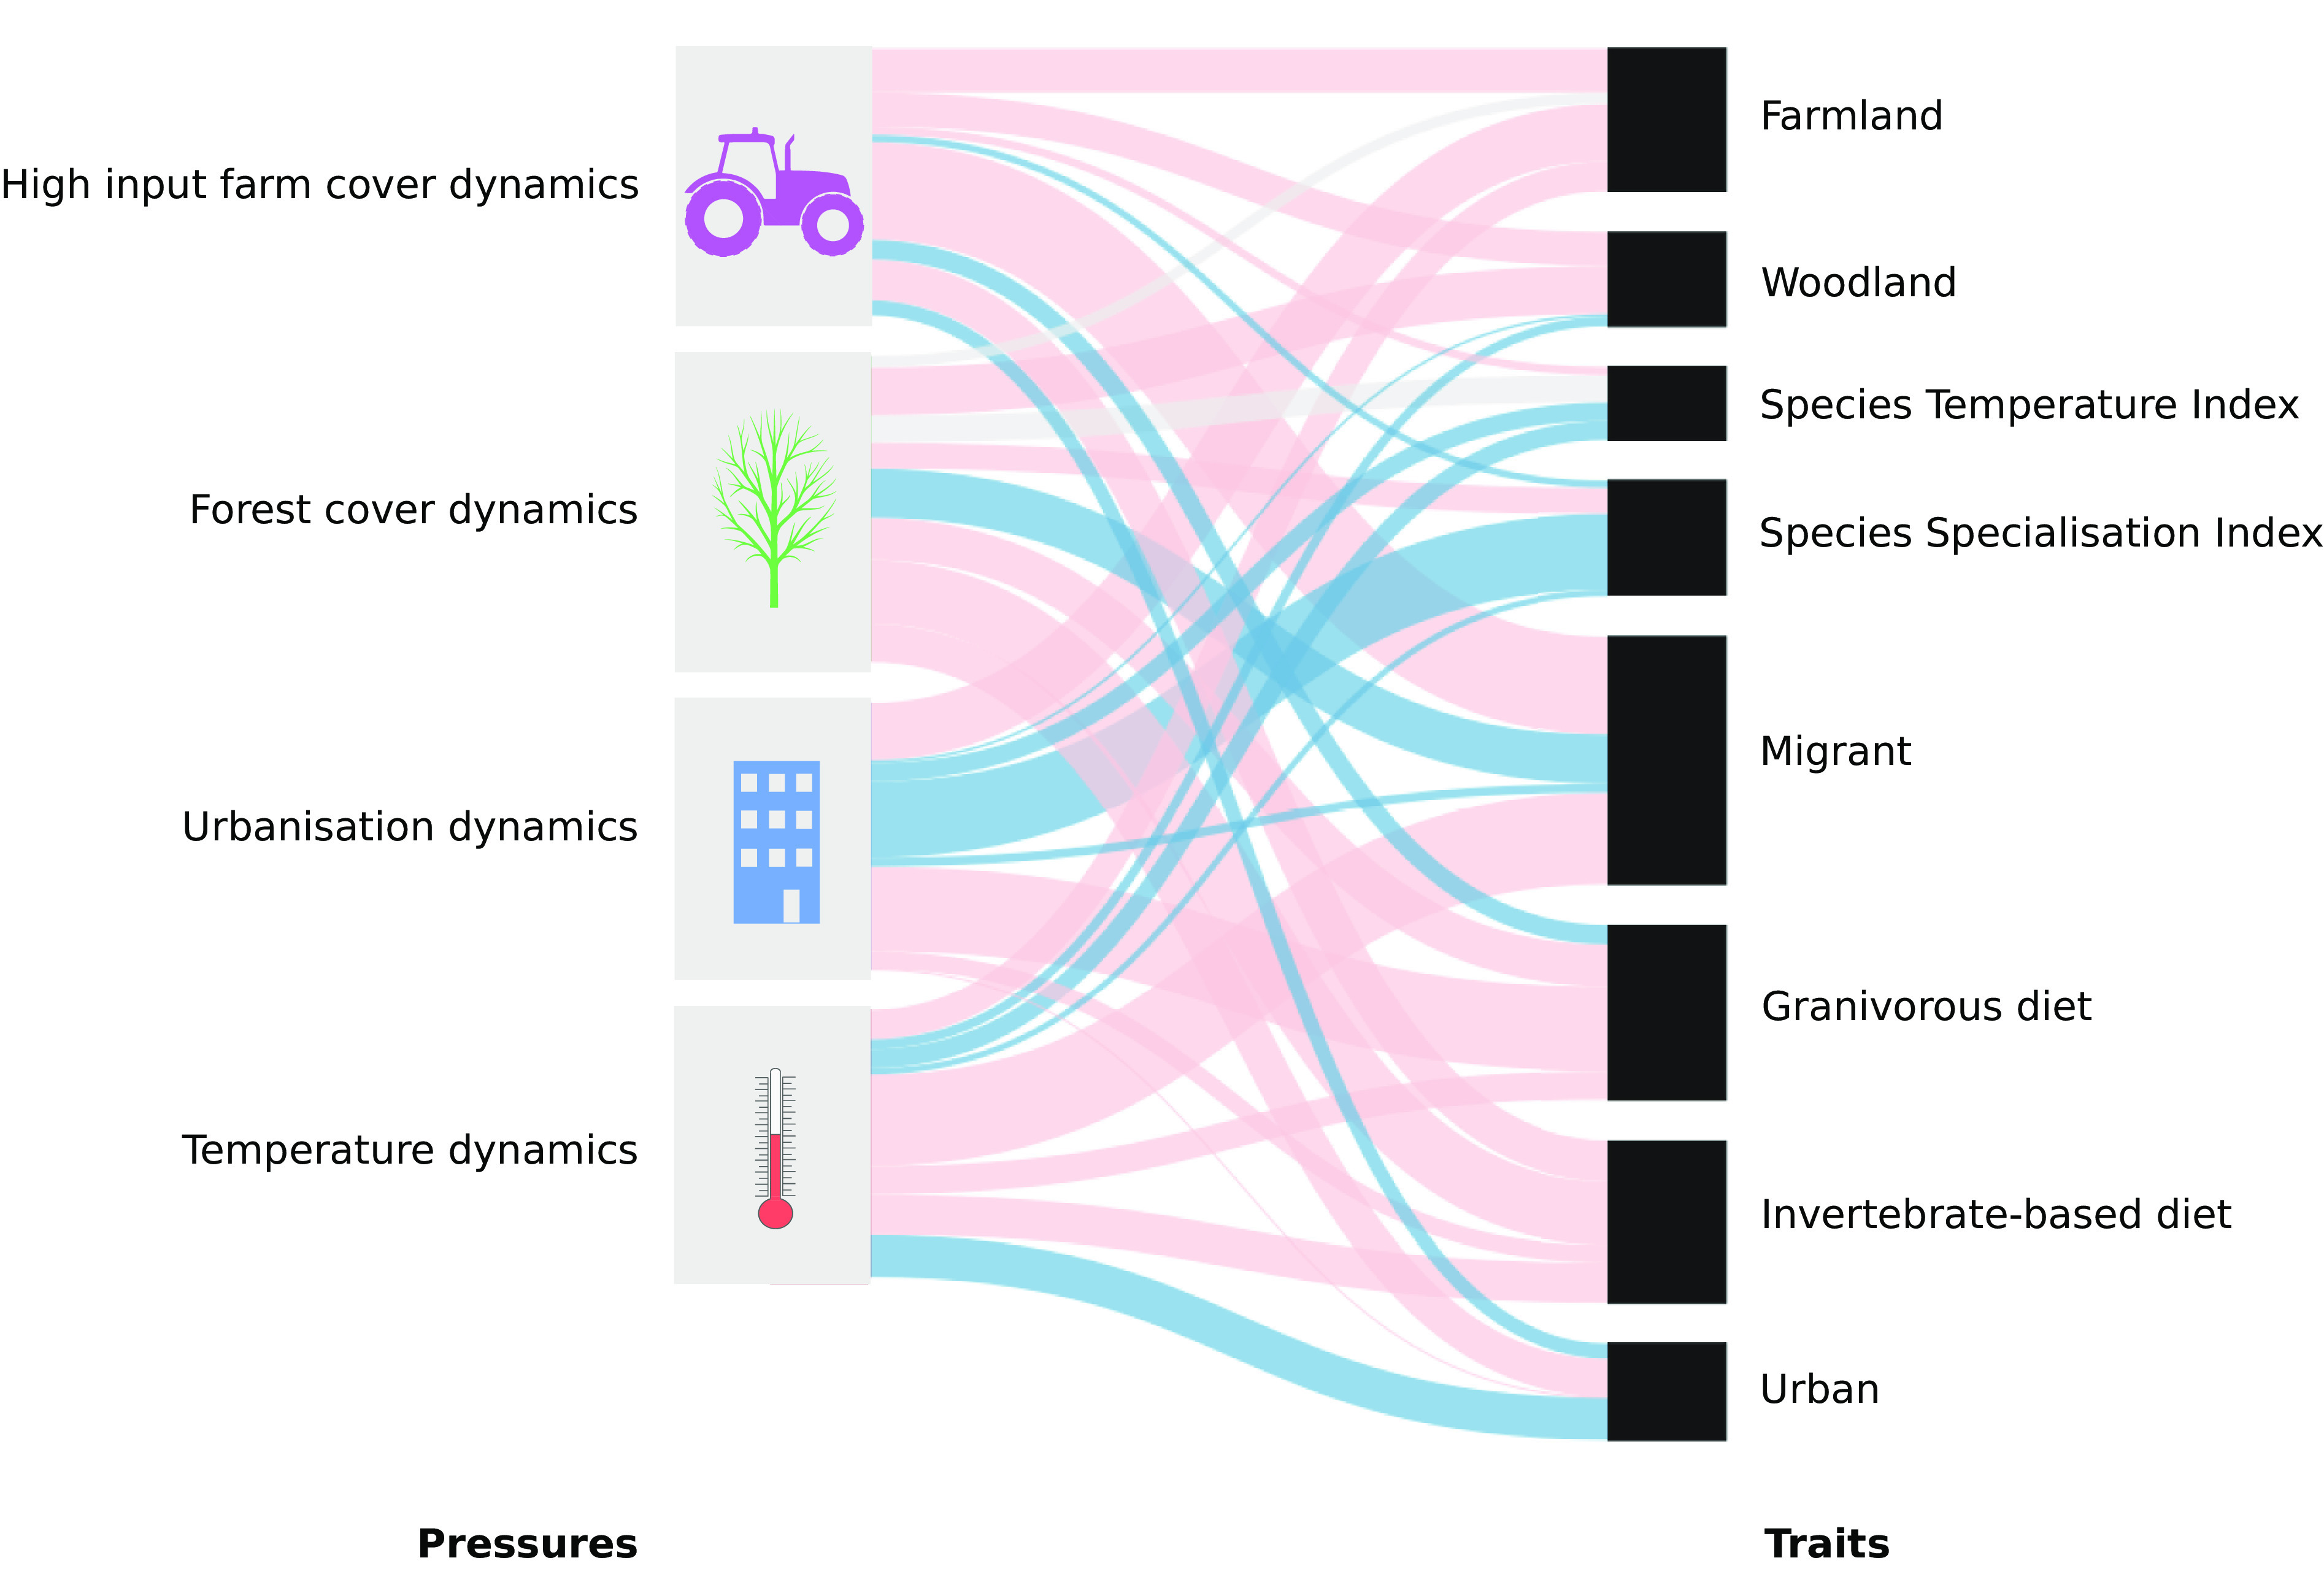
Fig. 4.

Results of the partial least square regression between each pressure influence on species time series and species traits. Nonsignificant effects are shown in gray, negative effects are shown in light red, and positive effects are shown in blue. The magnitude of the effect is displayed by the line width, scaled for each pressure.
