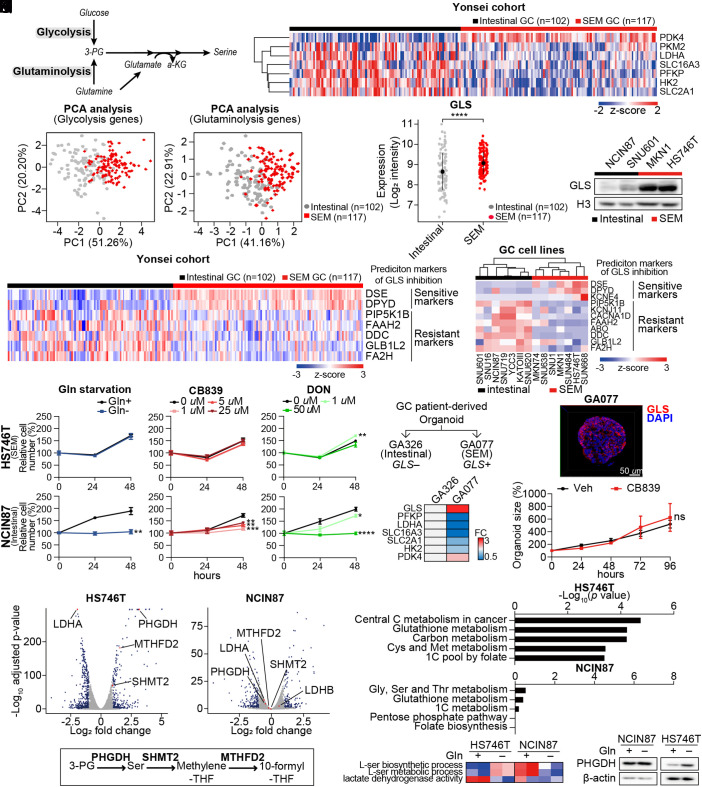
Fig. 1.
GLS-high SEM-type GC cells are resistant to GLS inhibition via upregulation of 1C metabolic pathway. (A) Schematic of glycolysis and glutaminolysis. (B) Analyses of transcriptomic profiles of tumors of GC patients in the Yonsei cohort. The expression levels of glycolysis-related genes were compared according to the subtypes: SEM (n = 117) and intestinal (n = 102). (C) PCA of GC patients in the Yonsei cohort with glycolysis-related genes introduced in B. (D) PCA of GC patients in the Yonsei cohort with glutaminolysis-related genes introduced in 1B. (E) Expression levels of GLS compared between SEM-type (n = 117) and intestinal subtype GC patients (n = 102) in the Yonsei cohort. (F) Immunoblotting of GLS in gastric cell lines. Histone H3 was used as the loading control. (G and H) Heatmap displaying the expression levels of sensitive markers (DSE, DPYD, and KCNE4) and resistance markers (PIP5K1B, KCNJ11, CACNA1D, FAAH2, ABO, DDC, GLB1L2, and FA2H) for GLS inhibition in the Yonsei cohort and GC cell lines (SRP078289). (I and J) Proliferation assays were performed for 48 h in HS746T and NCIN87 cells under glutamine-deficient and drug-treated conditions. CB839, GLS inhibitor; DON, glutamine antagonist. (K and L) Diagram describes selection of tumors for generation of patient-derived cancer organoids. Heatmap shows fold change in GLS and glycolysis-associated genes. (M) Immunocytochemistry image of GLS in GA077 stained with DAPI. (Scale bar: 50 μm.) (N) Sizes of patient-derived cancer organoid GA077 with or without 5 μM CB839 were measured. Organoid size measured by averaging short and long diameters (Right). n ≥ 5 (O) Transcriptomic profiles of glutamine starvation in HS746T and NCIN87 were analyzed via RNA sequencing analysis. Genes with fold change greater than 1.5 or less than −1.5 with adjusted P-values smaller than 0.05 are marked in blue. PHGDH, MTHFD2, SHMT2, and LDHA genes are marked in red. (P) Schematic of 1C metabolic pathway. (Q) KEGG analysis of differentially expressed genes. The P-values are less than 0.05. (R) GSVA was performed with pathways from MsigDB v7.4. Gene set enrichment score represented as a heatmap. (S) Immunoblot showing the protein levels of PHGDH upon glutamine starvation in HS746T and NCIN87. β-actin was used as a loading control. ns, no significance, *P < 0.05, **P < 0.01, ***P < 0.001, ****P < 0.0001, Wilcox test for 1E and two-tailed Student’s t test for I, J, and N.

