Fig. 3.
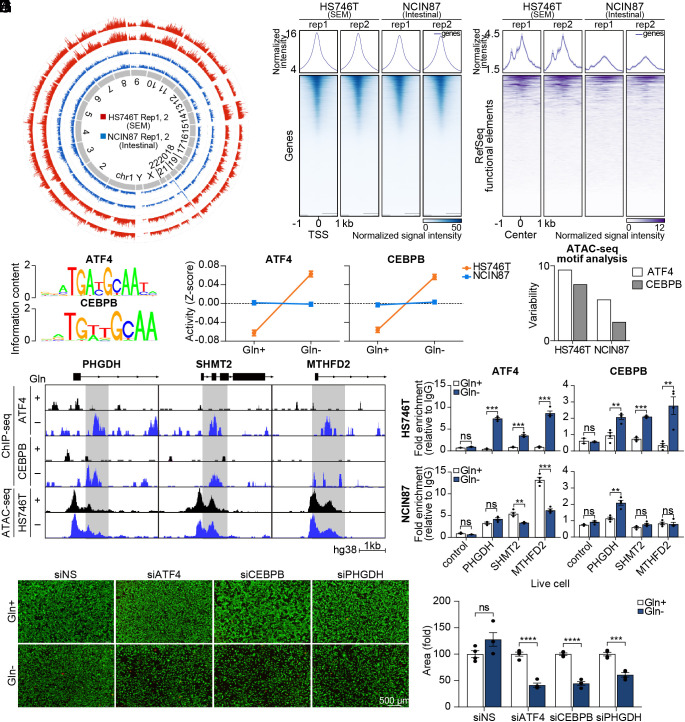
The landscape of chromatin accessibility shows ATF4 and CEBPB as transcriptional drivers of PHGDH-driven salvage pathway. (A) Circular plot showing genome-wide chromatin accessibility. (B) Heatmap of ATAC-Seq peaks in promoter regions. Color intensity represents chromatin accessibility. The peaks are aligned with the transcription start site (TSS) as the center. (C) Heatmap of ATAC-Seq peaks in RefSeq functional element regions. (D) Oligonucleotide sequence of ATF4- and CEBPB-binding site. (E) ISMARA with RNA sequencing data was performed. Motif activity is shown as a z-score. (F) Variability of motif activity upon glutamine starvation was computed with chromVAR. (G) ATF4 and CEBPB ChIP sequencing analysis were performed. The genome browser shows ChIP-seq profiles within the PHGDH, SHMT2, and MTHFD2 loci. (H) ChIP assay of the MTHFD2, PHGDH, and SHMT2 promoters using ATF4 and CEBPB antibodies in glutamine-deprived HS746T and NCIN87 cells. Data are represented as fold-change. (n = 4) (I) Microscopy images of HS746T cells with or without glutamine along with ATF4, CEBPB, or PHGDH knockdown. Live cells are shown with green color and dead cells are shown with red color. (Scale bar; 500 µm.) (J) The number of live cells was counted. (n = 4) ns, no significance, **P < 0.01, ***P < 0.001, ****P < 0.0001, two-tailed Student’s t test for H and J.

