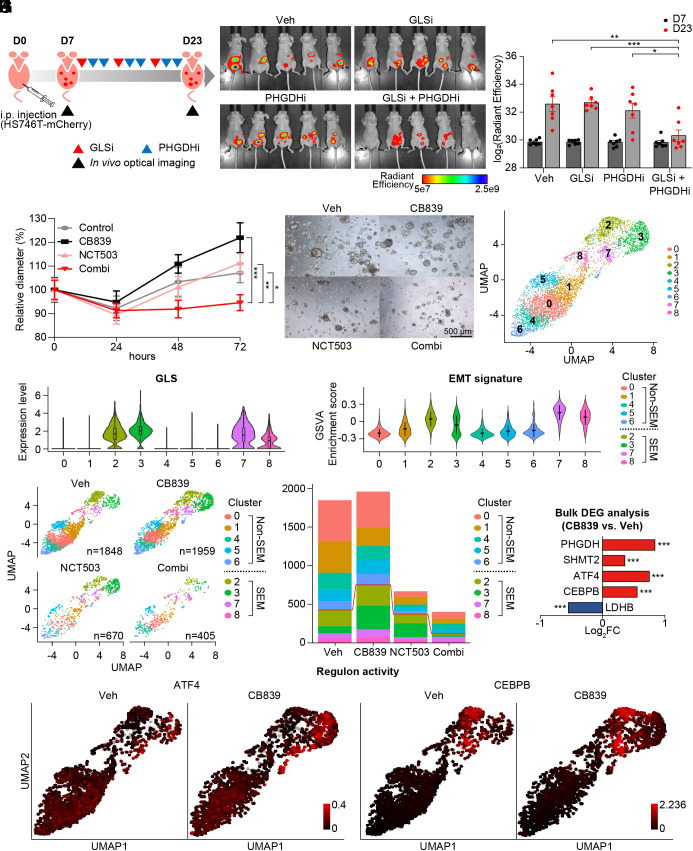
Fig. 4.
GLS inhibition activates ATF4/CEBPB-mediated transcriptional network in EMT signature-enriched clusters in patient-derived cancer organoids. (A) Diagram to explain the process in vivo experiment with vehicle, BPTES (12.5 mg/kg), NCT503 (40 mg/kg), or combination of BPTES and NCT503. (B) Representative picture of mice (n = 5) with tumor volume measured via in vivo optical imaging system. Total radiant efficiency (p/sec/cm2/sr/μW/cm2) was measured in peritoneal area. (C) Total radiant efficiency was compared in every group (n =7) before (D7) and after (D23) three cycles of BPTES/NCT503 injection. (D) Patient-derived cancer organoids GA077 were treated with 5 μM CB839, 50 μM NCT503, or both. The size was measured as the average of the short and long diameters (n ≥ 18). (E) Representative microscopy images of the organoid GA077 after different drug treatments. (F) Single-nucleus RNA sequencing was performed on GA077 with vehicle, CB839 (5 μM), NCT503 (50 μM) or both. Uniform manifold approximation projection (UMAP) visualization of cells is shown after integration. (G) The expression level of GLS is shown as a violin plot in the identified cell clusters. (H) GSVA was performed to calculate enrichment score with GO pathway “HALLMARK_ EPITHELIAL_MESENCHYMAL_TRANSITION” from MSigDB v7.4. (I) UMAP visualization of cells under different conditions: vehicle, CB839 (5 μM), NCT503 (50 μM) or both. (J) Fraction of cells from each sample for each cluster. (K) Gene expression level was compared as a bulk tumor. (L) Regulon activity (ATF4 and CEBPB) is marked as a color on the corresponding UMAP. *P < 0.05, **P < 0.01, ***P < 0.001, two-tailed Student’s t test for C and D and Benjamini–Hochberg adjusted P-value for K.

