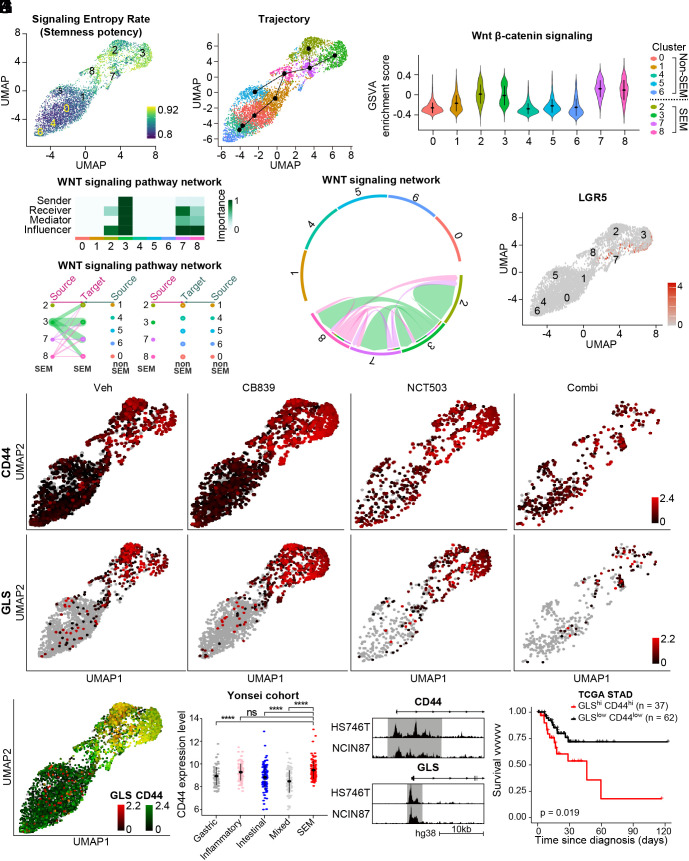
Fig. 5.
Coinhibition of GLS and PHGDH shows high efficacy in targeting stemness-high cell clusters. (A) Single-cell entropy (SCENT) analysis. Signaling entropy at the single-cell level was estimated across a population of cells and colored corresponding to the score in the UMAP plot. (B) Inferred cell lineage with Slingshot (C) GSVA was performed with WNT β-catenin signaling pathway from MsigDB v7.4. (D) A heatmap showing the relative importance of each cell cluster based on the computed four network centrality measures of the WNT signaling network. (E) Hierarchical plot showing the inferred intracellular network for the WNT signaling pathway. The color of the circles differs among clusters, and the edge width indicates the communication probability. (F) Inferred WNT signaling network with edge width representing the communication probability. (G) The expression level of LGR5 was plotted on the corresponding UMAP. (H) The expression levels of CD44 and GLS were plotted on the corresponding UMAP. (I) CD44 and GLS were coplotted on the corresponding UMAP with color intensity corresponding to the expression level. (J) The expression level of CD44 is compared according to the subtype in the Yonsei cohort: mixed (n = 99), gastric (n = 89), SEM (n = 117), intestinal (n = 102), and inflammatory (n = 90). (K) The genome browser shows ATAC-seq profiles in the promoter region of CD44 and GLS in HS746T and NCIN87, respectively. (L) Kaplan–Meier plot for CD44high/GLShigh (n = 37) and CD44low/GLSlow group (n = 62) in TCGA stomach adenocarcinoma cohort. One hundred and fifty tumor samples with highest or lowest gene expression were marked as high or low, resulting in the CD44high/GLShigh and CD44low/GLSlow group. Logrank P = 0.019. ns, no significance, ****P < 0.0001, Wilcox test for J.

