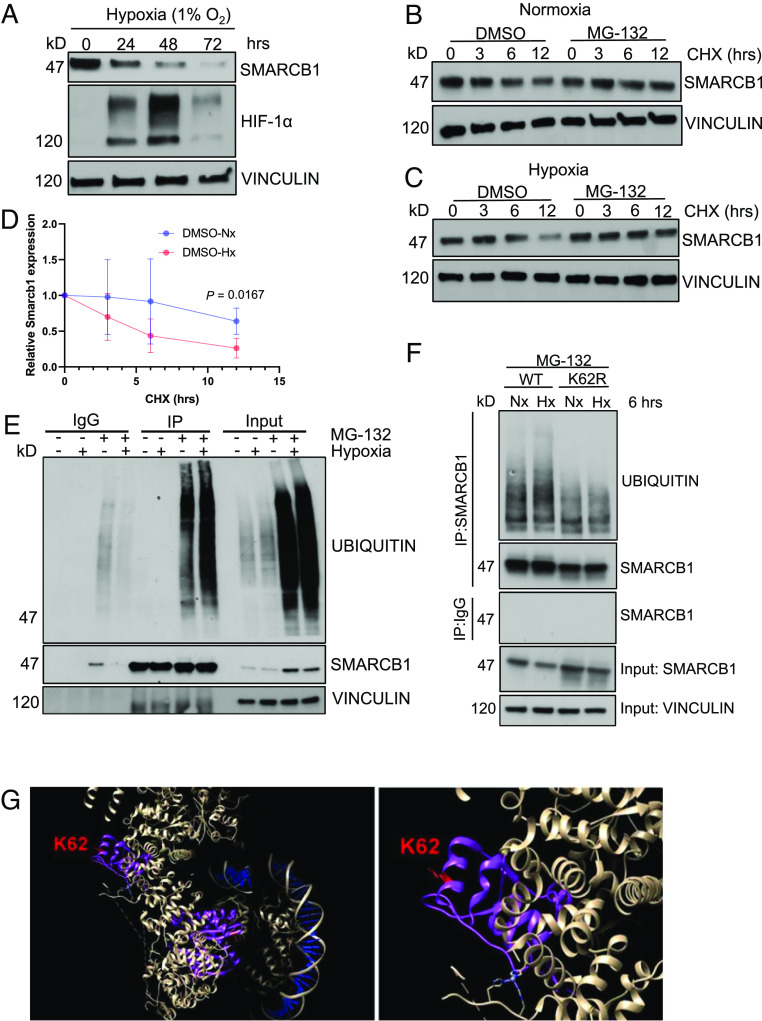
Fig. 2.
SMARCB1 is degraded via ubiquitin-proteasome-mediated degradation. (A) Immunoblotting analysis of mIMCD-3 cells after increasing time exposure to hypoxia (1% oxygen). (B) Cycloheximide chase assay of mIMCD-3 cells in 24 h of normoxia and (C) 24 h of hypoxia. Cells were treated with 20 μM cycloheximide for 0, 3, 6, and 12 h. (D) Quantification of SMARCB1 protein expression in mIMCD-3 after cycloheximide (CHX) chase experiment in 24 h of growth in normoxia and hypoxia. (E) Immunoprecipitation (IP) analysis of SMARCB1 ubiquitination after 6 h of hypoxia treatment. (F) MSRT1 cells ectopically overexpressing SMARCB1WT and SMARCB1K62R were cultured in 6 h of normoxia (21% oxygen) and hypoxia (1% oxygen) coupled with 3 h of treatment with 50 μM MG-132 to prevent proteasome degradation for subsequent immunoprecipitation assay. Protein analysis was then used to detect ubiquitin levels on SMARCB1. Data are expressed as mean value ±SD, with the P value calculated by Student’s t test. (G) Crystal structure of SMARCB1 (purple) in the SWI/SNF complex (white) bound to DNA (blue) using cryoelectron microscopy. Lysine residue 62 is indicated in red. The crystal structure was obtained from He et al. and UCSF Chimera software (https://www.cgl.ucsf.edu/chimera/download.html) was used to visualize crystal structure.

