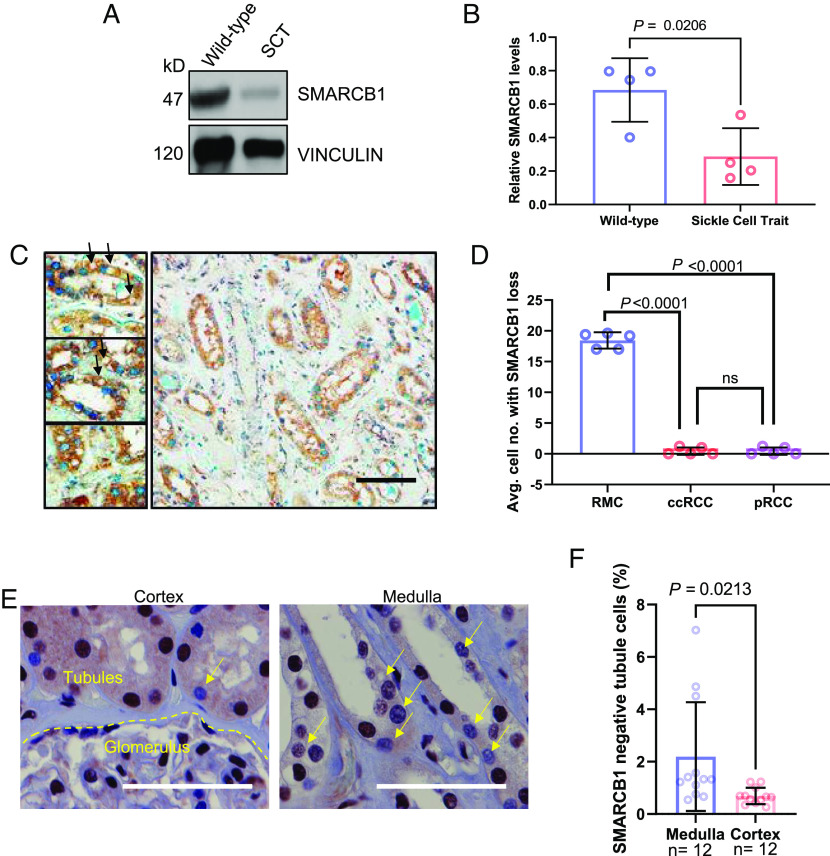
Fig. 3.
SMARCB1 protein expression is significantly lower in the renal medullary tubule cells of RMC patient nephrectomy samples and mouse models with sickle cell trait. (A) Representative image of immunoblotting analysis of kidney lysates from wild-type mice and mice with SCT. (B) Quantification of immunoblotting analysis of SMARCB1 protein in mouse kidney lysates. (C) RMC adjacent kidneys with SMARCB1 loss characterized using IHC analysis. SMARCB1 is indicated in blue (Alkaline phosphatase) staining and eIF2-alpha is indicated in HRP 3,3′-Diaminobenzidine (DAB) staining. The arrows indicate SMARCB1 loss. (D) Quantification of SMARCB1 protein in IHC experiment comparing normal adjacent kidney tissue in different renal tumors. Five 40X images were taken per patient and quantified. The average of five images is shown per patient and represented as a single dot in the plot. (E) IHC analysis of SMARCB1 protein expression in normal adjacent renal tissue from nephrectomy samples of two patients with RMC. Yellow arrows indicate SMARCB1-deficient tubule cells. (F) Quantification of SMARCB1-deficient tubule cells. The number of SMARCB1-deficient tubule cells was expressed as a percentage of total tubule cells in the 40X images. Data are expressed as mean value ±SD, with the P value calculated by Student’s t test.

