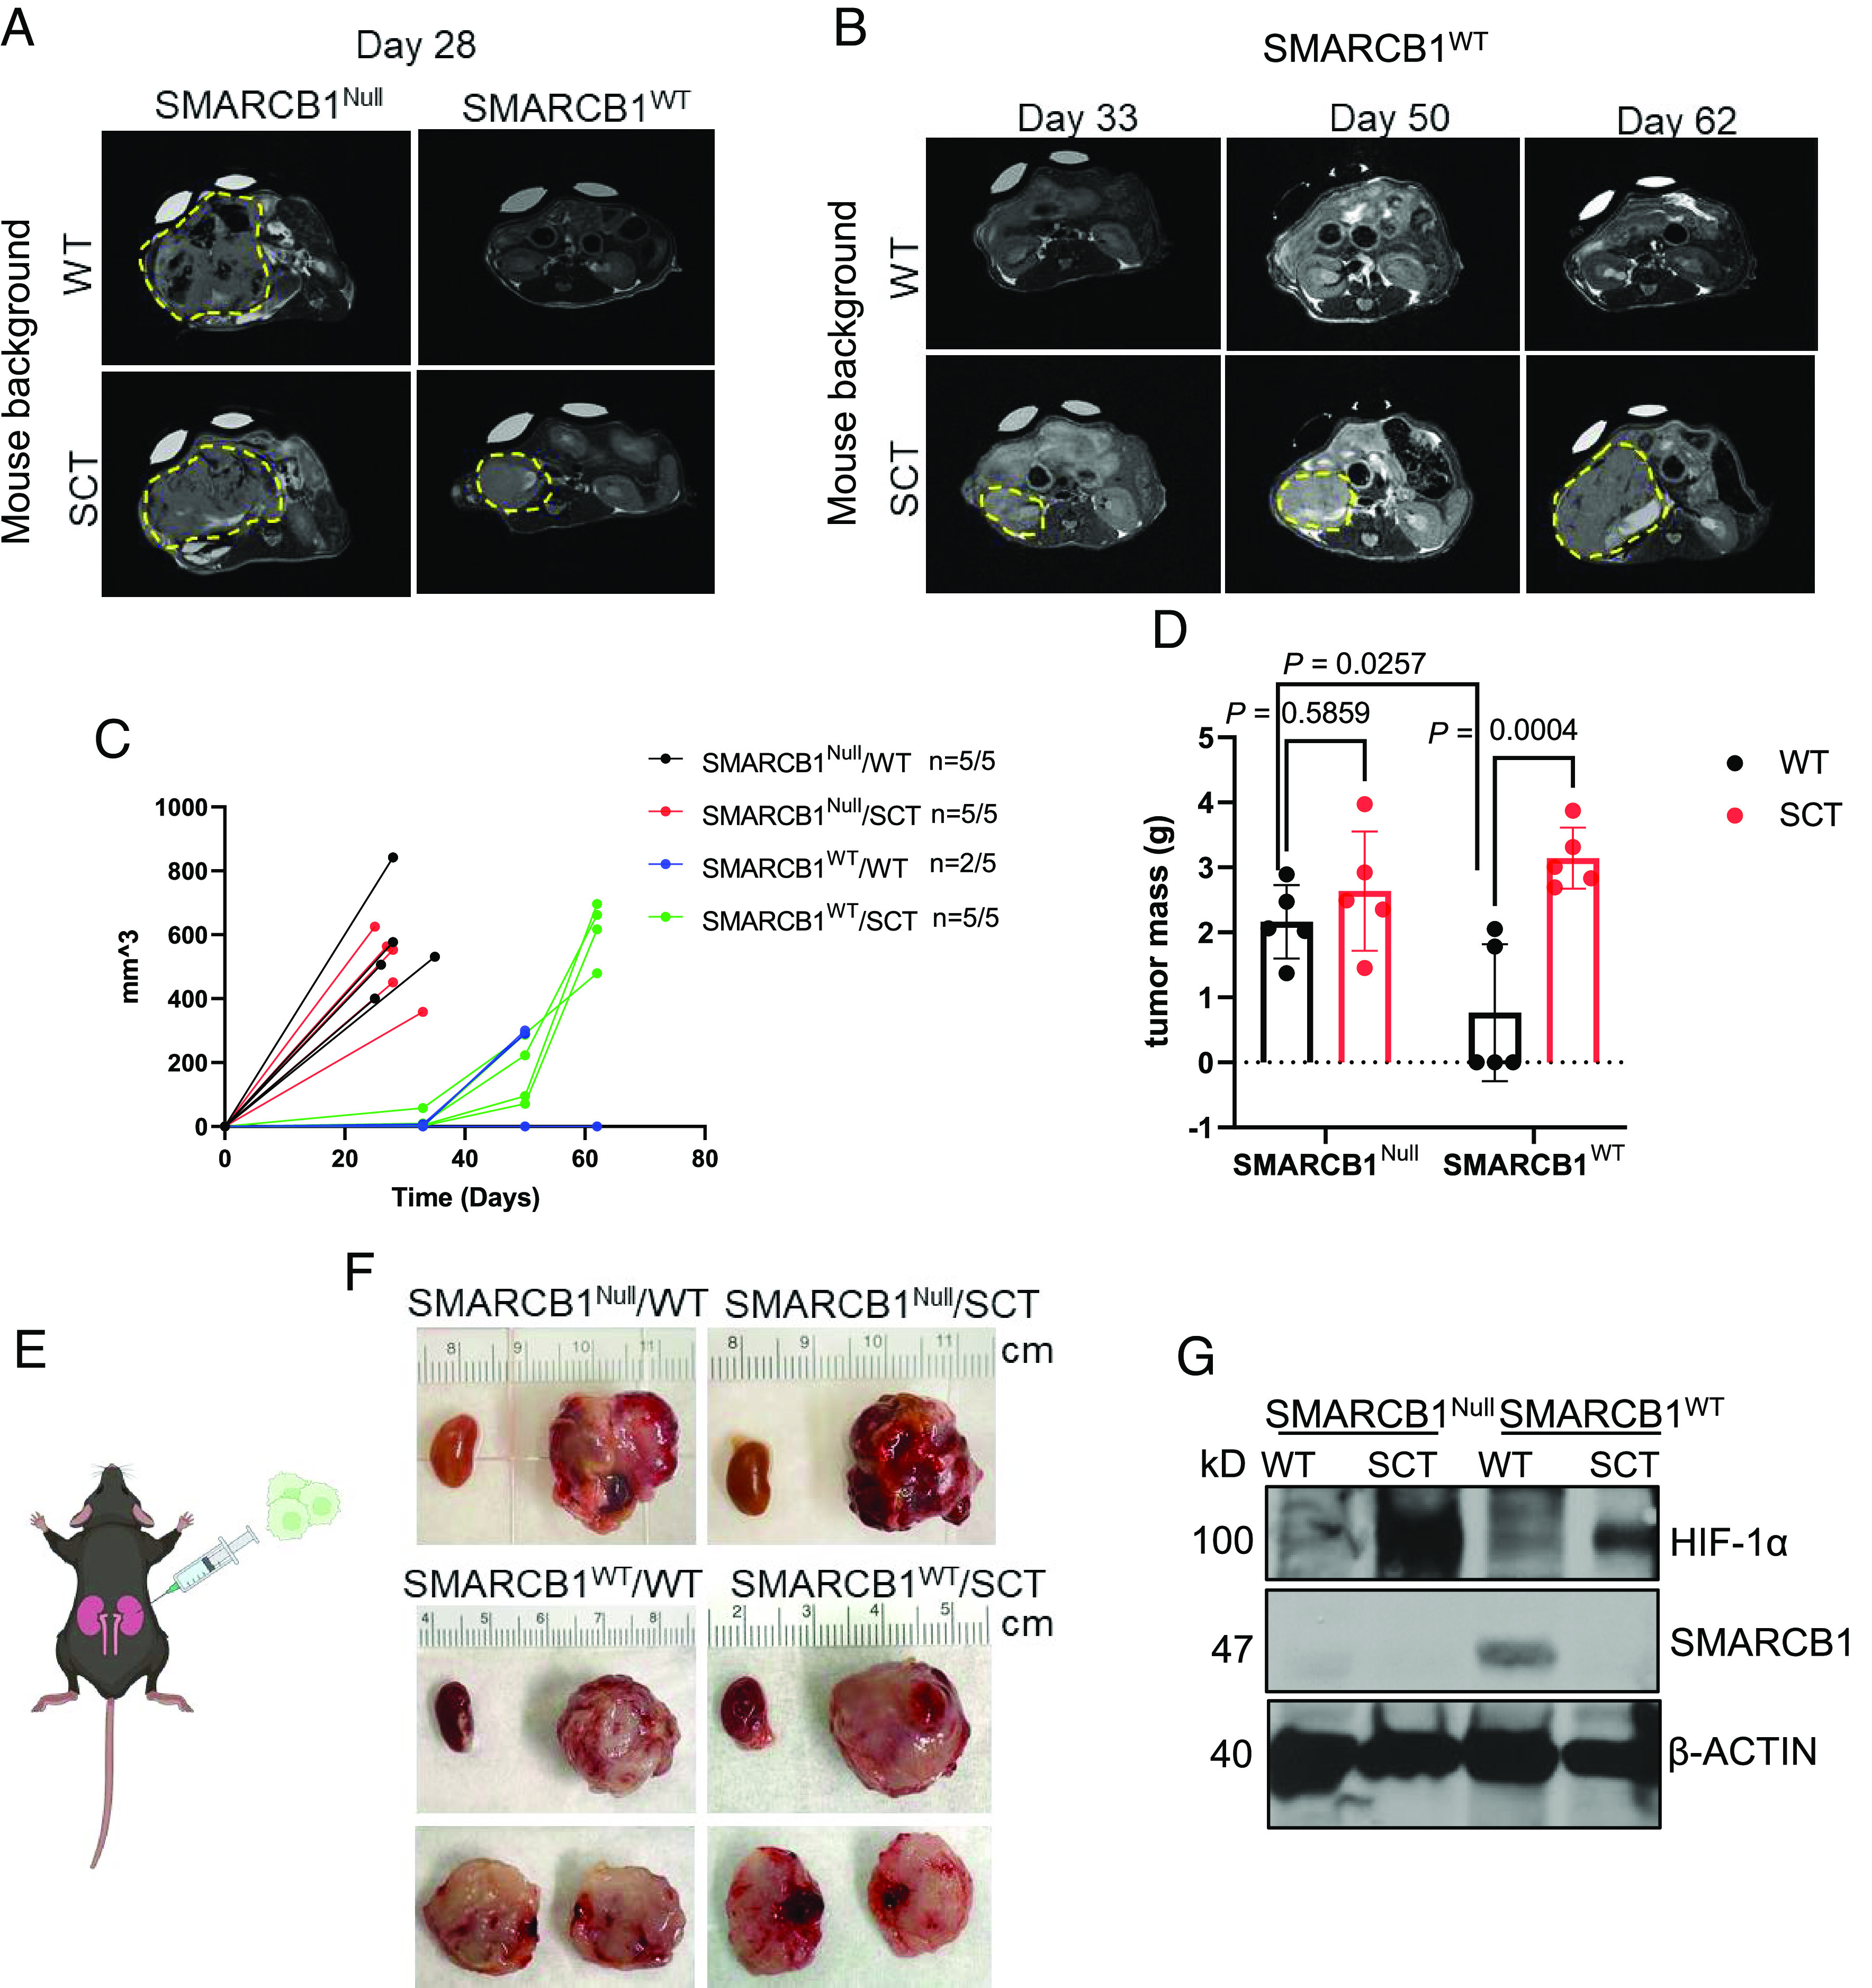
Fig. 6.

Sickle cell trait promotes tumor growth and aggressiveness in SMARCB1-deficient tumors. (A and B) Representative coronal T2-weighted MRI sections of tumor-bearing mice after orthotopic injection of MSRT1-SMARCB1Null and MSRT1-SMARCB1WT tumor cells into right kidney of wild-type mice (n = 5) and mice with sickle cell trait (n = 5). (C) Growth curve of primary kidney tumors. Tumor volume was quantified using coronal T2-weighted MRI sections at various timepoints after initial orthotopic injection of cells. ImageJ was used to calculate the tumor volume from T2-weighted MRI sections. (D) Final tumor mass of primary kidney tumors. (E) Schematic of orthotopic right kidney injections of MSRT1 tumor cell line. (F) Gross images of right primary kidney tumor compared to normal left kidney. Ruler increments are in cm. (G) Immunoblotting analysis of SMARCB1 and HIF-1α protein expression in orthotopic kidney tumors. β-ACTIN was used as the internal control for the immunoblotting analysis. Data are expressed as mean value ±SD, with the P value calculated by Student’s t test.
