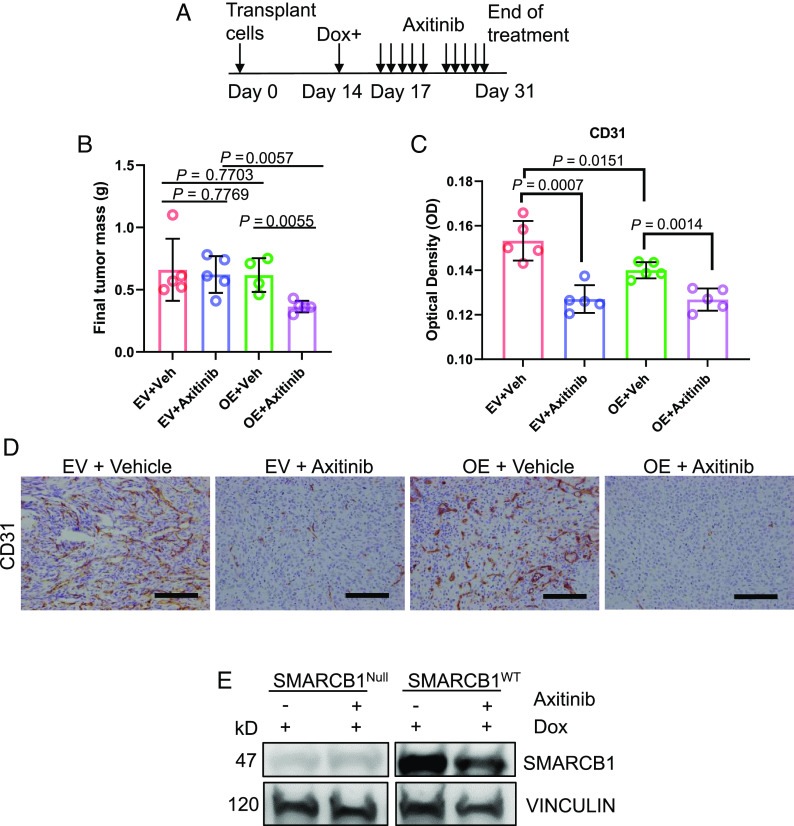
Fig. 7.
SMARCB1Null renal tumors are insensitive to angiogenesis inhibition. (A) Axitinib treatment schedule. (B) Final tumor mass of RMC219-tet-inducible cell lines that were injected subcutaneously (SQ) into NSG mice. Each dot represents one mouse. (C) and corresponding quantification of the optical density of CD31 IHC analysis. (D) Representative IHC image of CD31 staining of subcutaneous tumors treated with axitinib. Data are expressed as mean value ±SD, with the P value calculated by Student’s t test. (E) Representative immunoblotting analysis of final tumors after axitinib treatment. Data are expressed as mean value ±SD, with the P value calculated by Student’s t test.

