
Figure 2.
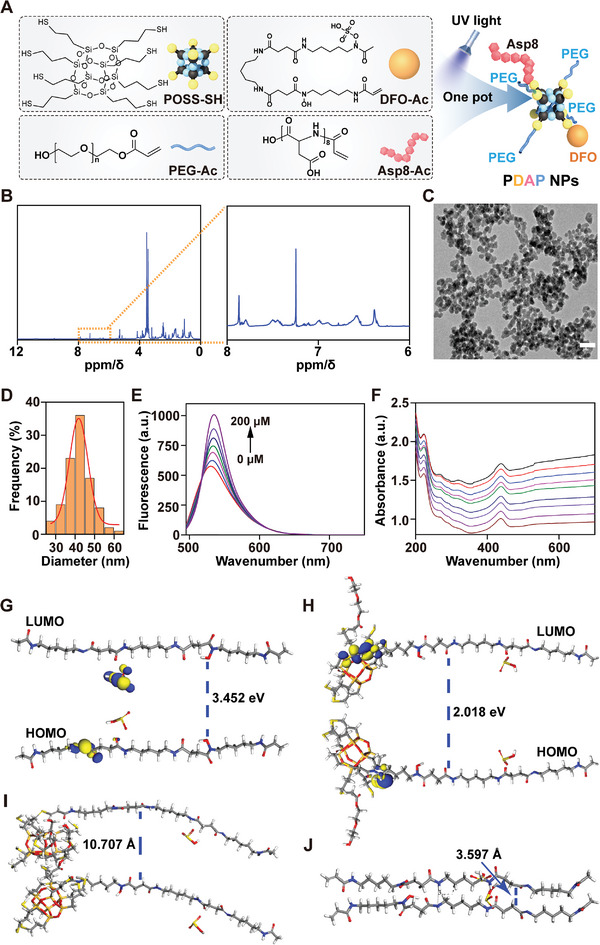
Characteristics of PDAP NPs. A) Schematic diagram of the synthesis of PDAP NPs. B) 1H NMR spectra of PDAP NPs. C) TEM image of PDAP NPs. Scale bars, 200 nm. D) Particle size distribution of PDAP NPs. E) Fluorescence spectra and F) UV–vis absorption spectrogram of PDAP NPs at different concentrations (≈0–200 µm). HOMO–LUMO orbital of G) POSS and H) POSS‐DFO. Molecular spacing of I) POSS‐DFO and J) POSS.