
Figure 3.
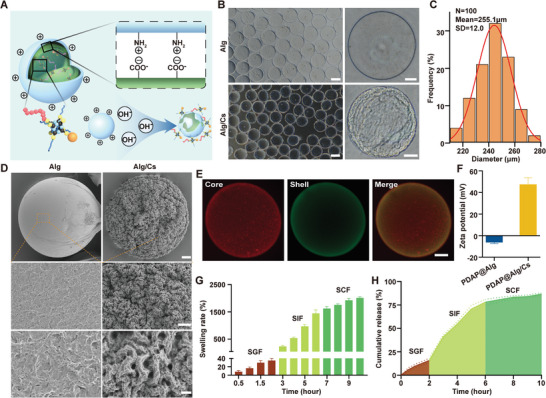
Characteristics of PDAP@Alg/Cs microspheres. A) Schematic diagram of the structure of PDAP@Alg/Cs microspheres. B) Optical microscopy images of PDAP@Alg and PDAP@Alg/Cs microspheres at different magnifications. Scale bars, 200 and 50 µm for left and right images, respectively. C) Size distribution of PDAP@Alg/Cs microspheres. D) SEM images of PDAP@Alg and PDAP@Alg/Cs microspheres at different magnifications. Scale bars, 10, 5, and 1 µm for top, middle, and bottom images, respectively. E) CLSM images of the shell‐core structure of Alg/Cs microspheres. Rho B(red) modified alginate (core), and FITC (green) modified chitosan (shell). Scale bars, 50 µm. F) Zeta potential of PDAP@Alg and PDAP@Alg/Cs (n = 3). G) Swelling rate of PDAP@Alg/Cs microspheres in SGF, SIF, and SCF (n = 3). H) Release curve of PDAP NPs from PDAP@Alg/Cs microspheres in SGF, SIF, and SCF.