
Figure 5.
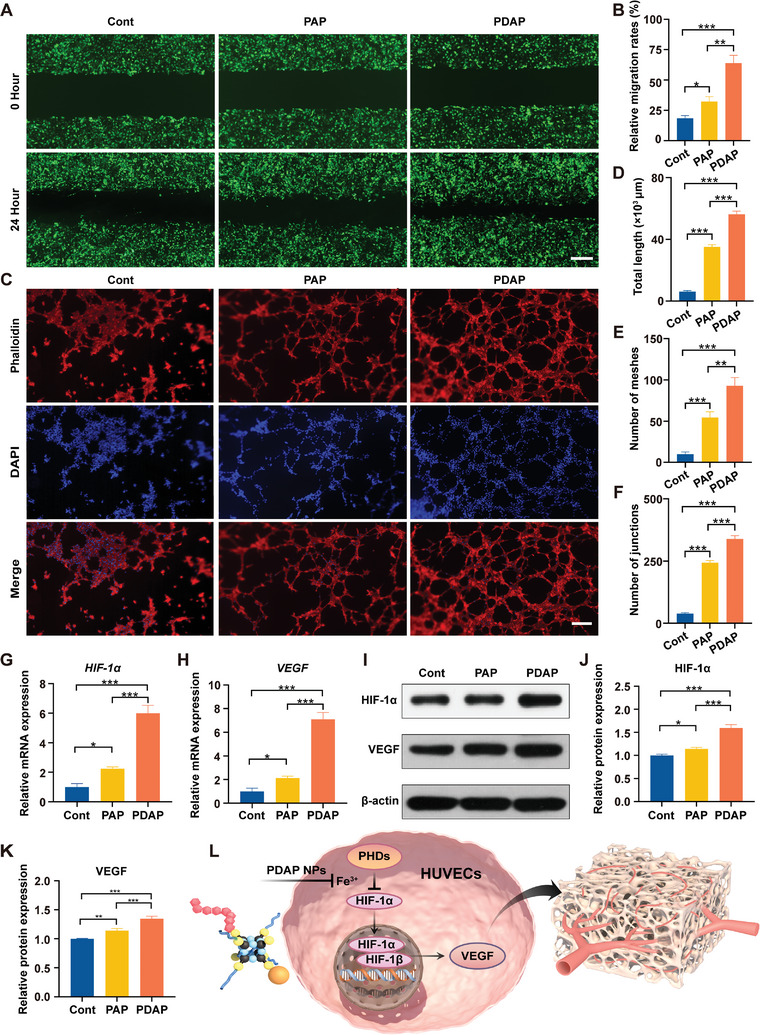
In vitro promotion of vascularization. A) Representative photomicrographs of HUVECs migration after incubation of 0 and 24 h. Scale bars, 400 µm. B) Quantitative analysis of wound migration rate on the cell migration results (n = 3). C) Representative photomicrographs of HUVECs tube formation on Matrigel. Scale bars, 50 µm. D) Total length of vascular tube formation (n = 3). E) Number of meshes (n = 3). F) Number of junctions (n = 3). G,H) Quantitative RT‐PCR detection of mRNA expression of HIF‐1α and VEGF (n = 3). I) Representative Western blot results for HIF‐1α and VEGF. J–K) Quantitative analysis of protein levels obtained from Western blot (n = 3). L) Schematic representation of PDAP NPs promoting vascularization.