Figure 8.

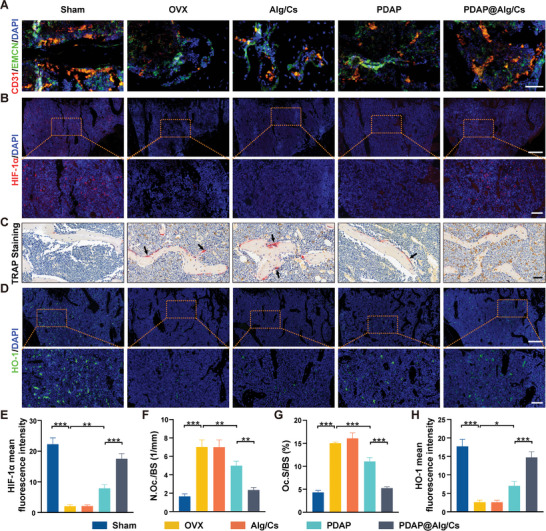
In vivo negative regulation of intraosseous angiogenesis and bone resorption. A) Representative image of CD31hiEMCNhi microvessels in the distal femur. Scale bars, 50 µm. B) Immunofluorescence staining of HIF‐1α in the distal femur. Scale bars, 200 and 50 µm for top and bottom images, respectively. C) Representative images of TRAP staining of the distal femur. Arrows point to multinucleated osteoclasts. Scale bars, 50 µm. D) Immunofluorescence staining of HIF‐1α in the distal femur. E) Scale bars, 200 and 50 µm for top and bottom images, respectively. F) Quantification of the HIF‐1α mean fluorescence intensity in different groups (n = 6). Quantification of G) No.Oc./B.Pm, H) Oc.S/BS from C) (n = 6). I) Quantification of HO‐1 mean fluorescence intensity in different groups (n = 6).
