
Figure 5.
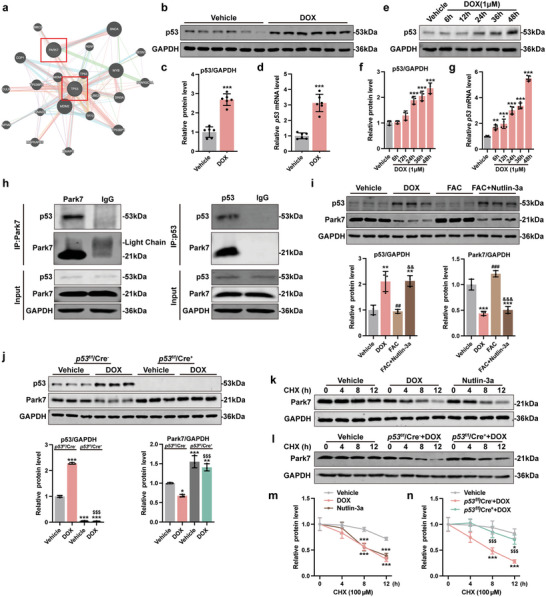
p53 is responsible for DOX‐induced downregulation of Park7. a) Protein interaction prediction of Park7 and p53 in GeneMANIA. b,c) Representative immunoblots and quantitative analysis of p53 protein level in AMCMs from chronic mice DoIC model (n = 6). d) p53 mRNA expression level in AMCMs from chronic mice DoIC model (n = 6). e,f) Representative immunoblots and quantitative analysis of p53 protein level in NMCMs treated with 1 µm DOX in different times (n = 3). g) p53 mRNA expression level in NMCMs treated with 1 µm DOX in different times (n = 5). h) Coimmunoprecipitation was performed to determine the interaction between endogenous Park7 and p53 in NMCMs. i) Representative immunoblots and quantitative analysis of Park7 and p53 protein level in NMCMs treated with DOX, FAC, or FAC plus Nutlin‐3a (n = 3). j) Representative immunoblots and quantitative analysis of Park7 and p53 protein level in NMCMs isolated from p53f/f/Cre− and p53f/f/Cre+ mice (n = 3). k) Representative immunoblots of Park7 protein level in NMCMs treated with DOX or Nutlin‐3a followed by a time‐dependent CHX treatment. The quantitative analysis was shown in (m) (n = 3). l) Representative immunoblots of Park7 protein level in NMCMs isolated from p53f/f/Cre− and p53f/f/Cre+ mice treated with DOX followed by a time‐dependent CHX treatment. The quantitative analysis was shown in (n) (n = 3). The data are expressed as mean ± SD and analyzed using Student's t‐test or one‐way ANOVA followed by Tukey's post hoc test, *p < 0.05, **p < 0.01, and ***p < 0.001 versus Vehicle group; #p < 0.05, ##p < 0.01, and ###p < 0.001 versus DOX group; &&&p < 0.001 versus FAC group; $$$p < 0.001 versus p53f/f/Cre−+DOX group.