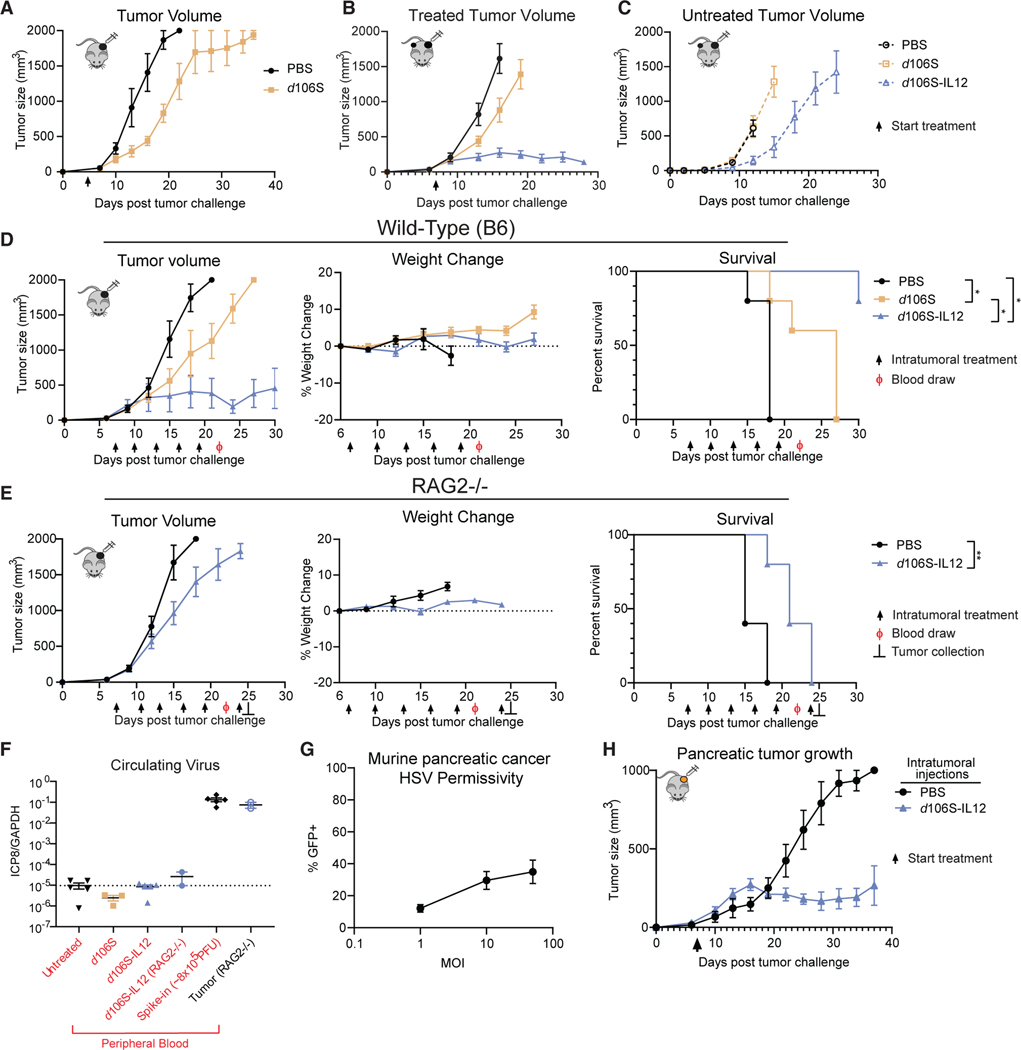
Figure 1. A mouse model of therapy-induced immune equilibrium.
(A) C57BL/6J mice were challenged with 5 × 10⁵ B16Nectin1 cells subcutaneously in the flank. Following 5 days of tumor growth, mice were randomized into treatment groups (N = 6 per group) and received intratumoral injection of 30 μL of either PBS or d106S (1.5 × 10⁷ PFU) every 3 days.
(B and C) Mice were challenged with a primary B16Nectin1 tumor (N = 10 per group) followed by a secondary, contralateral tumor 4 days later. Seven days after initial challenge, only the primary tumor was injected every 3 days with PBS, d106S, or d106S-IL12 for a total of 5 injections.
(D and E) Wild-type C57BL/6J (D) or RAG2−/− mice (E) were inoculated with unilateral B16Nectin1 tumors and injected intratumorally every 3 days with PBS, d106S (wild-type mice only), or d106S-IL12 for a total of 5 injections (N = 5 per group) starting on day 7 for a total of 5 injections. Weight change was normalized to immediately before treatment began. Arrows indicate treatment; Ф indicates blood draw; ⊥ indicates RAG2−/− sacrifice (2 mice) for tumor DNA extraction.
(F) qPCR for viral DNA (ICP8) from DNA extracted from peripheral blood draw (day 22 surviving mice) and tumor (day 25 RAG2−/−). Untreated mice also bore tumors but did not receive treatment. Spike-in control received 8 × 10⁵ PFU of virus into untreated blood. Dotted line indicates limit of detection based on untreated samples.
(G) Wild-type 6694c2 pancreatic cancer cells were infected with varying MOIs of d106S (GFP) and infection measured by flow cytometry (n = 4).
(H) Mice were challenged subcutaneously with 2 × 10⁵ 6694c2 cells and treated every 3 days starting on day 7 (N = 5 PBS, N = 5 d106S-IL12).
Values are mean ± SEM. Survival groups were compared using a Bonferroni-corrected log-rank test. *p < 0.05; **p < 0.01.

