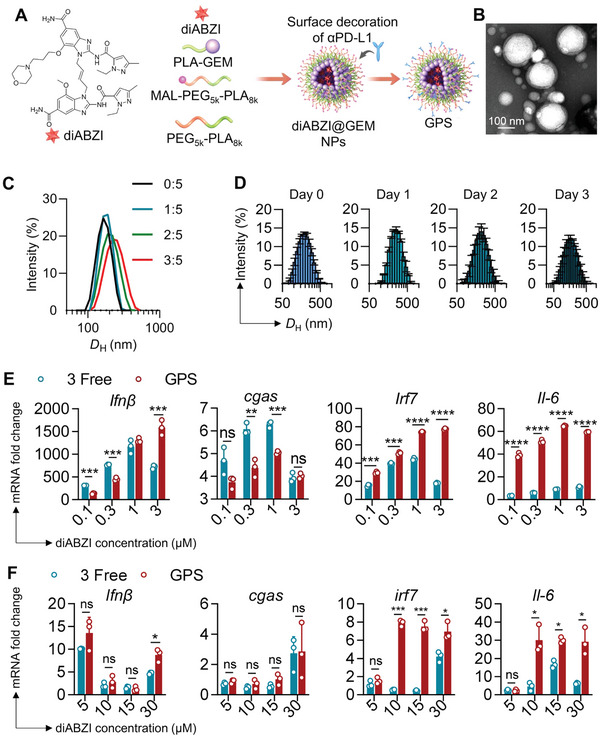
Figure 4.

Design and characterization of the GPS therapeutic. A) Schematic illustration of the generation of GPS. B) TEM images of GPS NPs. Scale bars: 100 nm. C) D H of GPS as determined by DLS analysis (diABZI was loaded at different mass ratios; the ratios are presented as diABZI:GEM). D) D H of GPS NPs (loaded at a mass ratio of 1:5) as determined by DLS analysis. NPs were dissolved in saline medium supplemented with 20% FBS, which mimics the physiological environment. E,F) qPCR analysis of IFN‐β, cGAS, IRF7, and IL‐6 gene expression in (E) BMDCs and (F) 4T1 after treatment with diABZIs or a physical mixture of free diABZI, GEM, and αPD‐L1 (referred to as 3 free). The X axis shows the equivalent dose of diABZI. The gene expression of Gapdh was defined as an internal reference; all treatment group data were compared to the data in untreated BMDCs or 4T1 (control). Statistical analysis was performed with ANOVA. *p<0.05, **p < 0.01, and ***p < 0.001.
