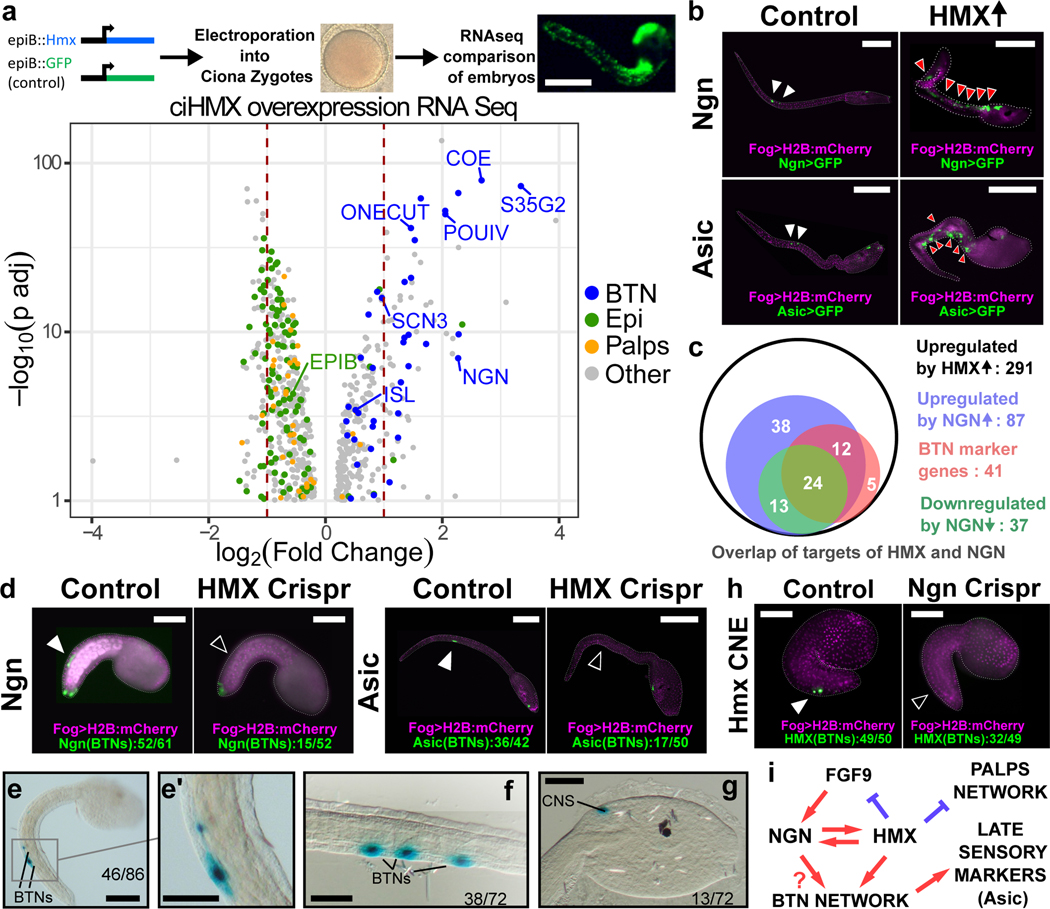
Figure 2. Hmx regulation and downstream target genes in Ciona.
a. Above is a schematic of the strategy used to drive Ciona Hmx overexpression. Below the volcano plot shows genes up or down regulated after Ciona Hmx overexpression. Selected genes are named. Colour coding reflects genes identified as cell type expressed in single cell sequencing data2, according to the code shown. Data analysed using negative binomial generalized linear models the DESeq234, P values adjusted (p adj) for multiple testing. Table 1 shows precise numbers, underlying data in Supplementary File 1.b. Expression of Ngn>GFP and Asic>GFP constructs in control embryos (white arrowheads) and in cells ectopically expressing Hmx driven by epiB>Hmx (red arrowheads). c. Overlap of upregulated Hmx target genes and genes differentially expressed after Ngn overexpression and knockdown22. Subset of genes upregulated by Hmx overexpression that were also upregulated by Ngn overexpression or downregulated by Ngn knockdown and BTN expressed genes from single cell data2 are shown. Full data in Supplementary File 2. d. BTN marker activity after Hmx CRISPR Cas9 knockout. Fog>H2B:mCherry marks successful uptake of the electroporation mix. BTN signal for both early (Ngn) and late (Asic) markers (closed arrowheads) was lost after Hmx knockout (open arrowheads). Numbers in Extended Data Table 1. e-g. Ciona Hmx CNE activity in Ciona embryos, visualised by lacZ staining. (e) shows a tailbud stage embryo with stain in BTNs, seen in close up in (e’). (f,g) show BTN and CNS staining respectively in early larvae. Numbers indicate number of embryos showing staining in the indicated structures, out of total surviving embryos. Full embryo counts in Extended Data Table 3. h. Ciona Hmx CNE activity in controls (closed arrowhead) and its loss after Ngn CRISPR Cas9 knockout (open arrowhead). Fog>H2B:mCherry marks successful uptake of the electroporation mix. Numbers in Extended Data Table 2. i. BTN specification network model. Scale bars 100μM except e-g (50μM).

