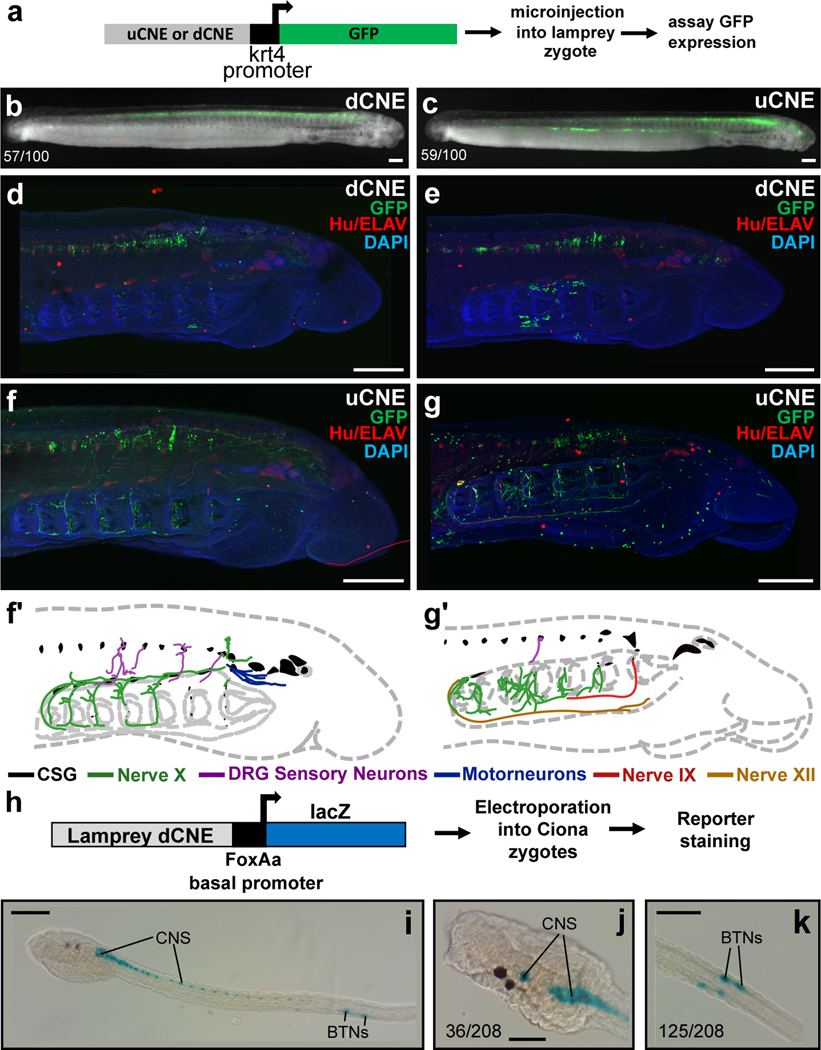
Figure 4. Lamprey Hmx CNE activity in transgenic lamprey and Ciona embryos.
a. Experimental strategy for detecting reporter activity in lamprey embryos. b, c. Representative embryos showing dCNE>GFP and uCNE>GFP activity in the CNS. Numbers show the number of times CNS expression was seen out of the number of embryos screened. Analysis of vector-only controls is shown in Extended Data Fig. 7. d, e. Confocal reconstructions of lamprey embryos transgenic for dCNE>GFP, showing activity (green) in forebrain, midbrain, hindbrain and spinal cord. f, g. Confocal reconstructions of lamprey embryos transgenic for uCNE>GFP, showing activity in the CNS, and in peripheral nerves. In (d-g) ganglia and other neurons are stained red using an antibody to Hu/ELAV. f’, g’ Schematic tracing of embryos shown in (f) and (g) respectively, with nerve CNE reporter activity traced and colour coded. h. Schematic of the experimental method used to examine lamprey CNE activity in Ciona. i-k. Transgenic Ciona larvae stained for lamprey dCNE reporter activity. Numbers indicate the number of times expression in the cells identified was seen, out of total surviving larvae. Full embryo counts in Extended Data Table 3. All scale bars 100μM.

