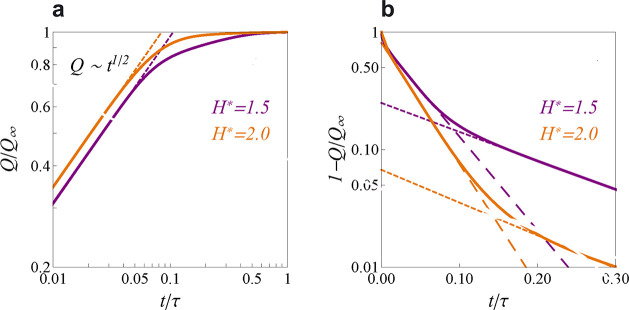
Figure 17.
Dynamics of charging slit nanopores from time-dependent
DFT. (a)
Total charge accumulated in a pore as a function of time for two pore
widths H/d = 1.5 and H/d = 2, where d is the ion diameter,
assumed the same for cations and anions. (b) Charging in the linear-log
scale showing two exponential regimes denoted by long-dashed and short-dash
lines. Initially, the charge grows as a square root of time and follows
by two exponential regimes at intermediate and late times, in line
with ref (112) (section 4.5.1, Figure 9) and molecular dynamics
simulations113,125 (section 6.4.2, Figure 30). In all plots, applied potential U = 10 and  , where
  is the pore length. Reproduced with permission
from ref (174). Copyright
2022 MDPI under CC BY (https://creativecommons.org/licenses/by/2.0/).

