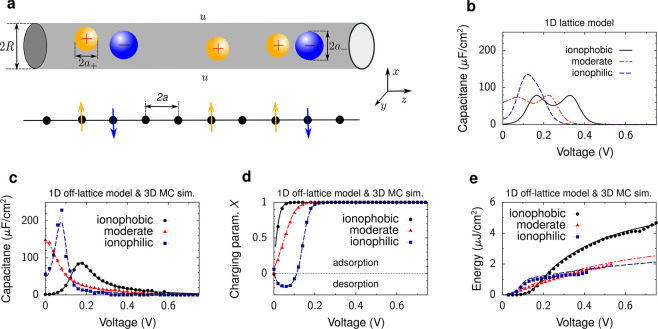
Figure 3.
Charge storage in single-file pores. (a) Model
of a metallic cylindrical
nanopore of radius R. An electrostatic potential
difference u is applied to the nanopore with respect
to bulk electrolyte (not shown). The ion radii are a = a± < R. In
1D lattice and off-lattice models, the centers of ions and solvent
molecules (if any) are located on the symmetry axis of the nanotube.
In the lattice model, the ions are located on the lattice sites. The
lower cartoon shows the lattice model with the arrows symbolizing
the spins oriented up or down, corresponding to the cations and anions
in the nanotube shown above. (b) Results of 1D spin–lattice
mode given by eq 18 (lower
cartoon in (a)). Capacitance is shown as a function of applied potential
difference for strongly ionophilic (chemical potential μIL(lat) = −0.961
eV) and ionophobic pores  , and for a pore moderately filled with
ions
  . (c–e) Results of 1D off-lattice
model (lines) and 3D MC simulations (symbols). (c) Capacitance, (d)
charging parameter X, 7, and (e) stored energy density
are shown as functions of voltage. Parameter X >
0 (X < 0) corresponds to the charging driven by
a combination of ion swapping and counterion adsorption (co-ion desorption).
The chemical potentials were adjusted so as to provide the same in-pore
ion densities as the lattice model in panel (b): μIL = −0.8 eV and μIL = −1.1 eV for the
ionophilic and ionophobic pores, and μIL = −0.95
eV for the moderately filled pore. The plots have been created using
the data from ref (44). In all plots, the ion radius a = 0.25 nm, the
pore radius R = 0.26 nm, the in-pore dielectric constant
ε = 2.5, and temperature T = 293 K.

