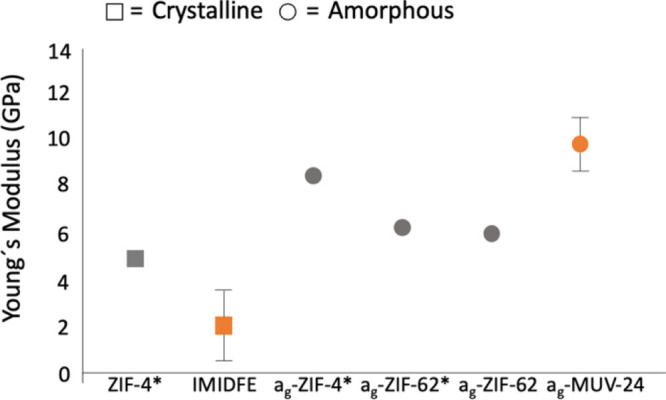
Figure 5.

Comparison of Young’s modulus between crystalline (square) and glassy (circle) ZIFs. The gray color represents the ZIFs with Zn centers, while the orange color refers to iron centers. Values marked with an asterisk correspond to previously reported data.8a
