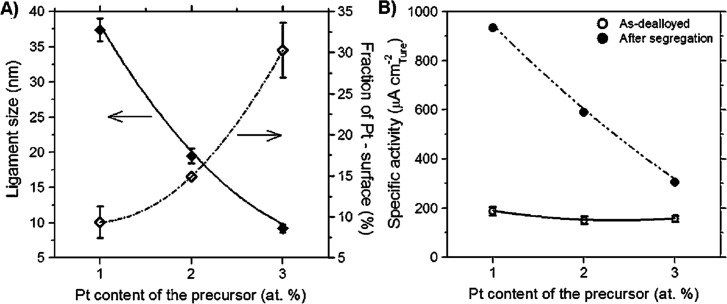
Figure 31.
MOR studied at NPG obtained from Ag77Au23–xPtx (x = {1, 2, 3}) at 298 K with and without surface segregation of Pt during treatment at 425 °C for 2 h. (A) Variation of ligament size and surface Pt content. (B) Comparison of peak current densities before and after Pt surface segregation. Peak current densities are calculated with respect to the true surface area. v = 10 mV s1, 1 mol L1 MeOH + 5 mol L1 KOH, quiescent solution. Reproduced in part with permission from ref (525). Copyright 2016 Springer.

