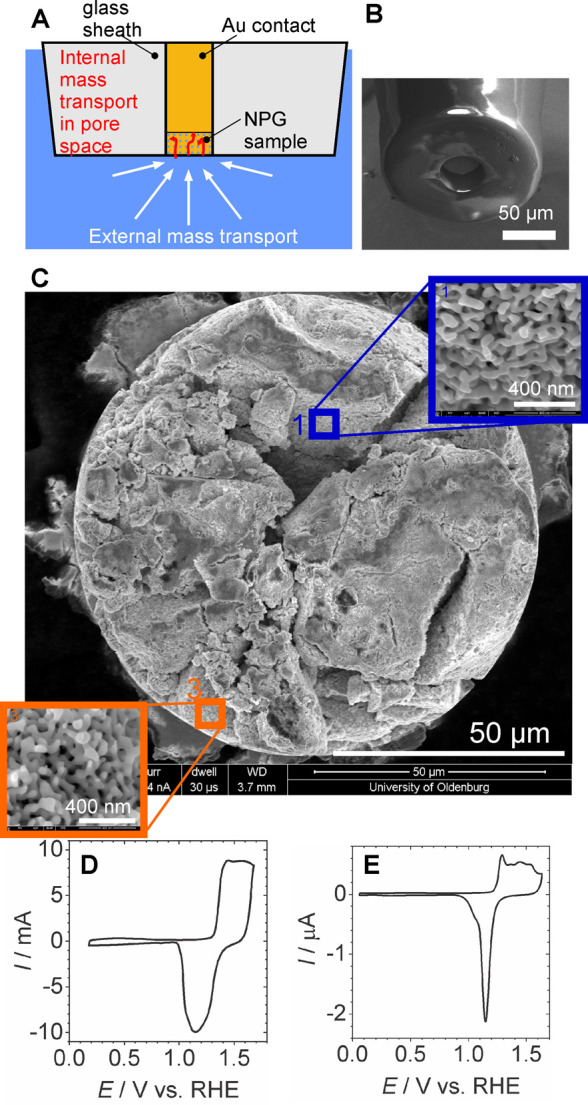
Figure 6.

Cavity microelectrodes. (A) Schematic cross section; (B) SEM image of empty cavity microelectrode produced by etching a glass-sealed gold wire; (C) SEM image of a cavity microelectrodes filled with NPG powder, insets show zoomed areas with NPG ligaments; (D) cyclic voltammogram of a macroscopic NPG monolith in 1 mol L–1 HClO4, potential scan rate v = 10 mV s–1; (E) cyclic voltammogram of the very same NPG material inside a cavity microelectrode in 1 mol L–1 HClO4, v = 10 mV s–1. (B) Reproduced with permission from ref (238). Copyright 2019 Wiley-VCH. (C) Adapted from ref (191) under Creative Commons license CC 4.0. Copyright 2020 The Authors. (D,E) Reproduced with permission from ref (638). Copyright 2022 The Author.
