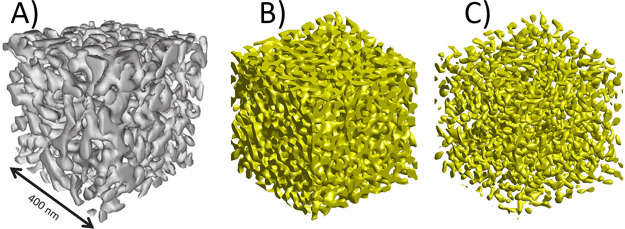
Figure 8.
3D geometry and topology of NPG’s microstructure. (A) Rendering of an experimental tomographic reconstruction; solid fraction φ = 0.30.124 (B) Rendering of a leveled-wave model generated structure with φ = 0.30.269 (C) Rendering of the identical realization of the leveled-wave model, yet with φ = 0.10.269 Note the remarkable qualitative agreement between experimental and model structures. Note also that the model structure with φ = 0.10 represents an array of disconnected clusters, not a percolating and loadbearing network. (A) Reproduced with permission from ref (124). Copyright 2016 Taylor and Francis Ltd. (B,C) Reproduced with permission from ref (269). Copyright 2016 The Authors.

